

- Add widgets
- Survey Comparison
- Heatmap
- Confidentiality Settings
- eNPS in Workforce Analytics Portal
- Notes Widget
- Text Analysis Widget
- Response rate
- Text Report
- Trend analysis widget
- Show/hide Markers and Building blocks
- Question Filter
- Single Question Widget
- Heatmap default
- Sentiment analysis
- Scorecard
- Driver analysis
- Scorecard: All options view
- Heatmap Column Types
- Multiple Tabs in a Dashboard
- Tab Exports
- AI Summary and Recommendations
- 360 feedback introductory text
- 360 feedback display configurations
- 360 feedback display labels
- Multi Level Priority Logic
- 360 Surveys- Priority Model
- 360 feedback - skip logic
- 360 feedback - show hide question logic
- 360 Survey Settings
- 360 feedback configuration
- Customize the validation text
- 360 Survey design
- 360-Reorder section
- 360 Section Type - Single Select Section
- 360 Delete Sections
- 360 Add Sections
- 360 section type - Free responses text section
- 360 Section Type - Presentations text section
- 360 Section-Edit Configurations
- 360 Survey- Languages
- Matrix section

Driver Analysis: Quadrant View
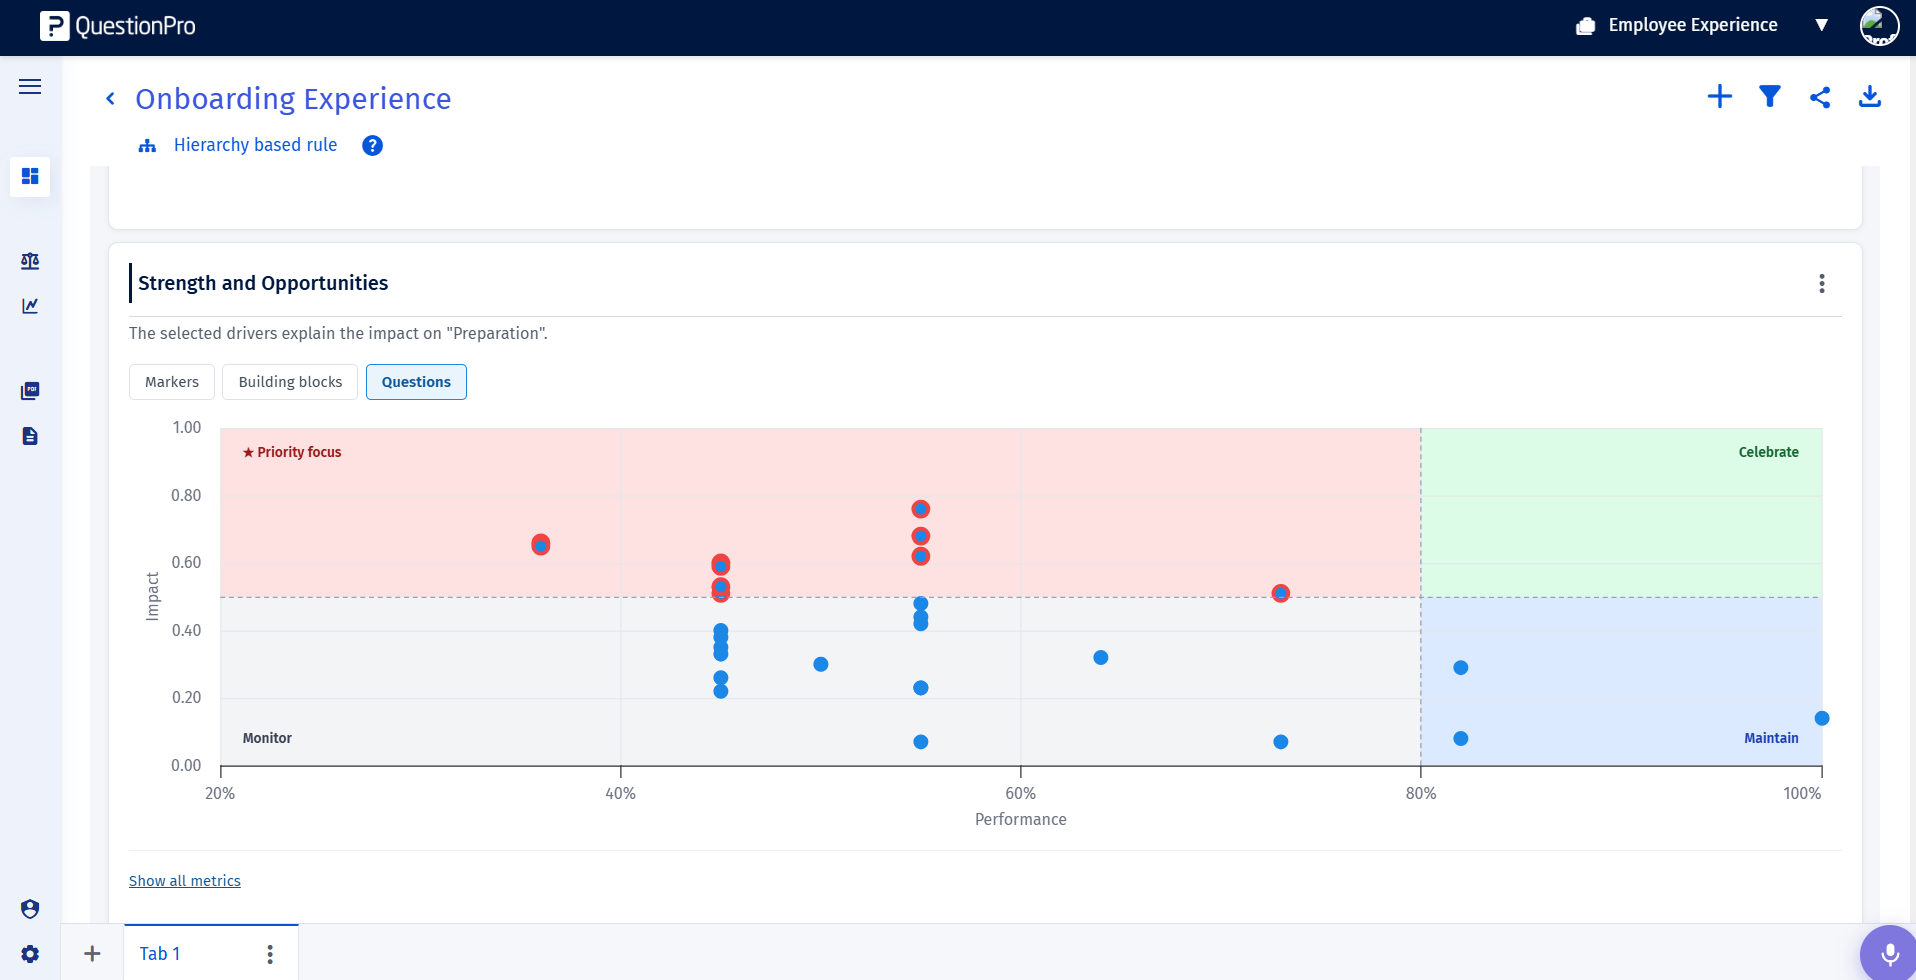
The Driver Analysis widget in the QuestionPro EX Portal provides a visual priority map to help organizations identify which workplace drivers genuinely impact employee engagement and key organizational outcomes. By plotting drivers on an intuitive two-axis scatter chart, the Quadrant View allows leaders and HR analysts to immediately distinguish high-impact drivers from low-performing areas without needing complex statistical interpretation:
- Impact (Y-axis): Calculated using absolute Pearson correlation values (|r|) to show how strongly each driver correlates with the selected outcome variable. The horizontal threshold divider is fixed at 0.5 (representing a large-effect boundary).
- Performance (X-axis): Measured as normalized favorability percentage (0-100) across all question types. The vertical threshold divider is fixed at 80% (representing a healthy EX performance benchmark).
- Priority Focus (Top-Left): High impact, low performance. Critical areas requiring immediate focus and action planning. Data points in this zone are highlighted with a distinct red ring.
- Celebrate (Top-Right): High impact, high performance. Primary organizational strengths to sustain and celebrate.
- Monitor (Bottom-Left): Low impact, low performance. Secondary focus areas to monitor without immediate high priority.
- Maintain (Bottom-Right): Low impact, high performance. Stable strengths that support overall workplace satisfaction.
Watch this video for a quick overview to understand more:
Click to download the video
How do I configure and use the Driver Analysis Widget?
To create and configure a Driver Analysis widget in your EX Dashboard, follow these steps:
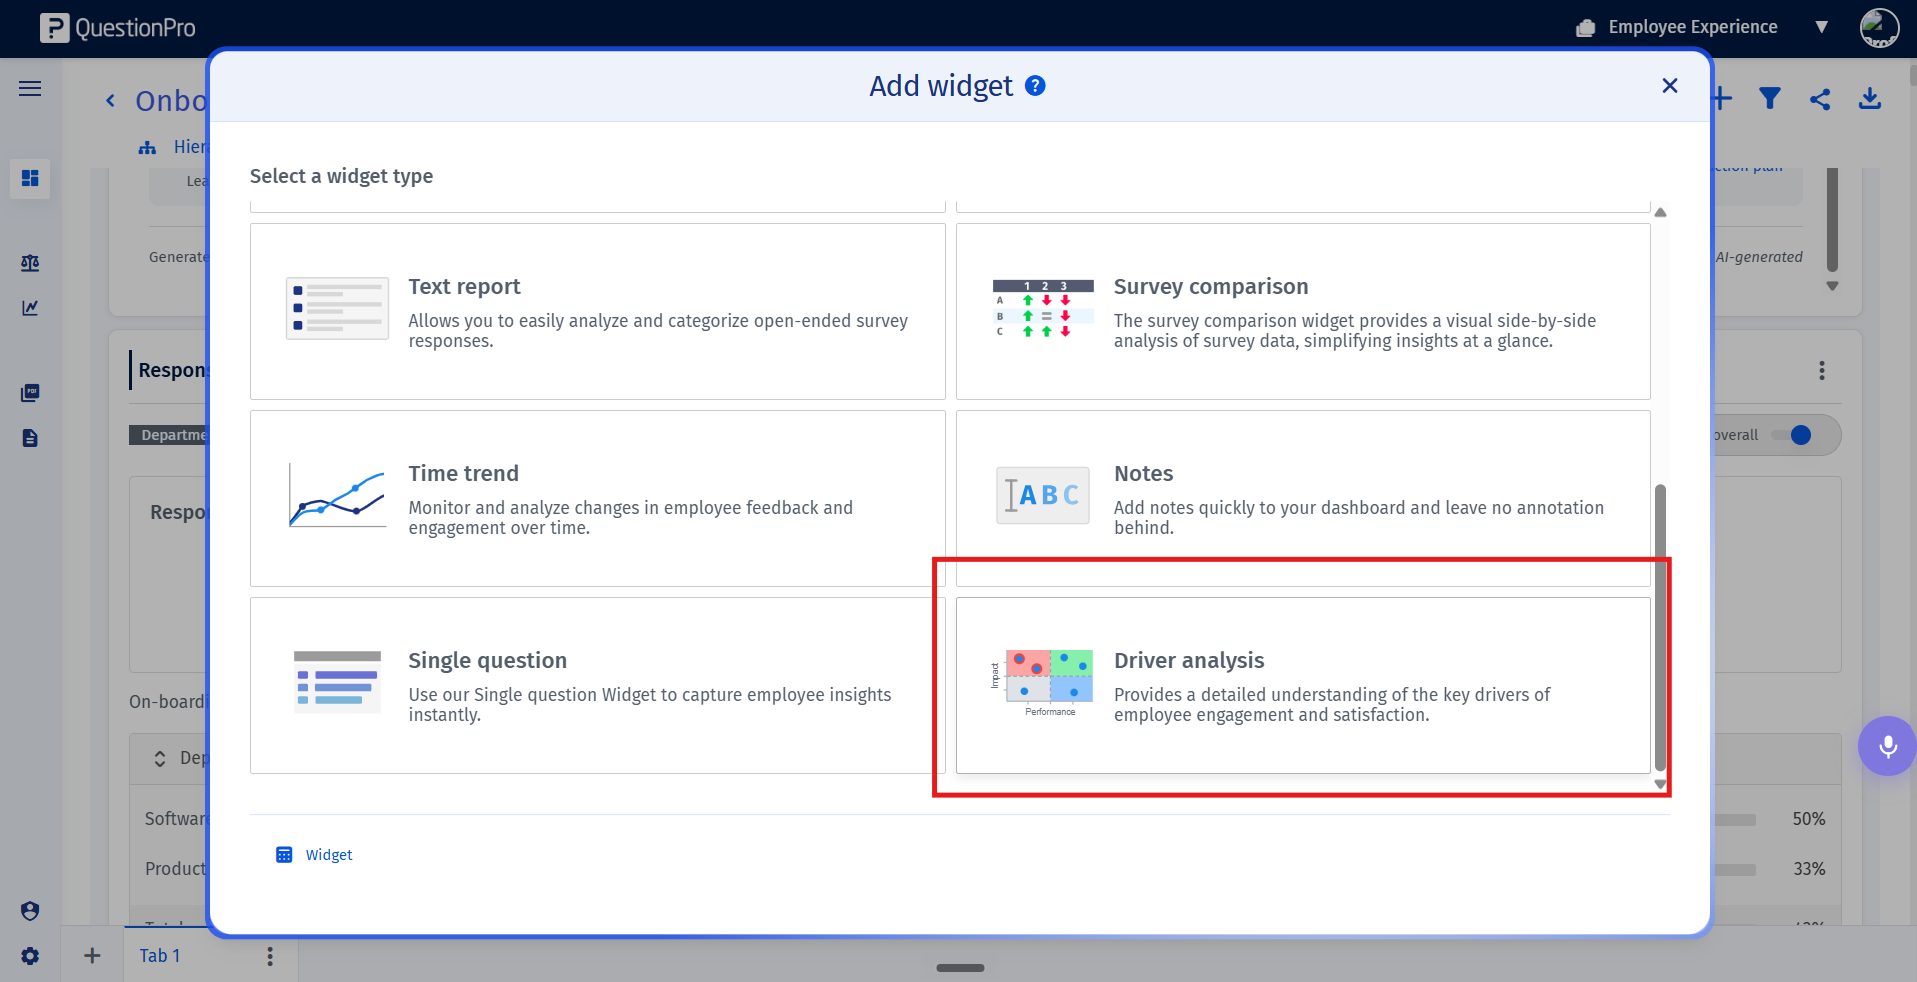
- In your EX Portal Dashboard, click on Add Widget and select Driver Analysis.
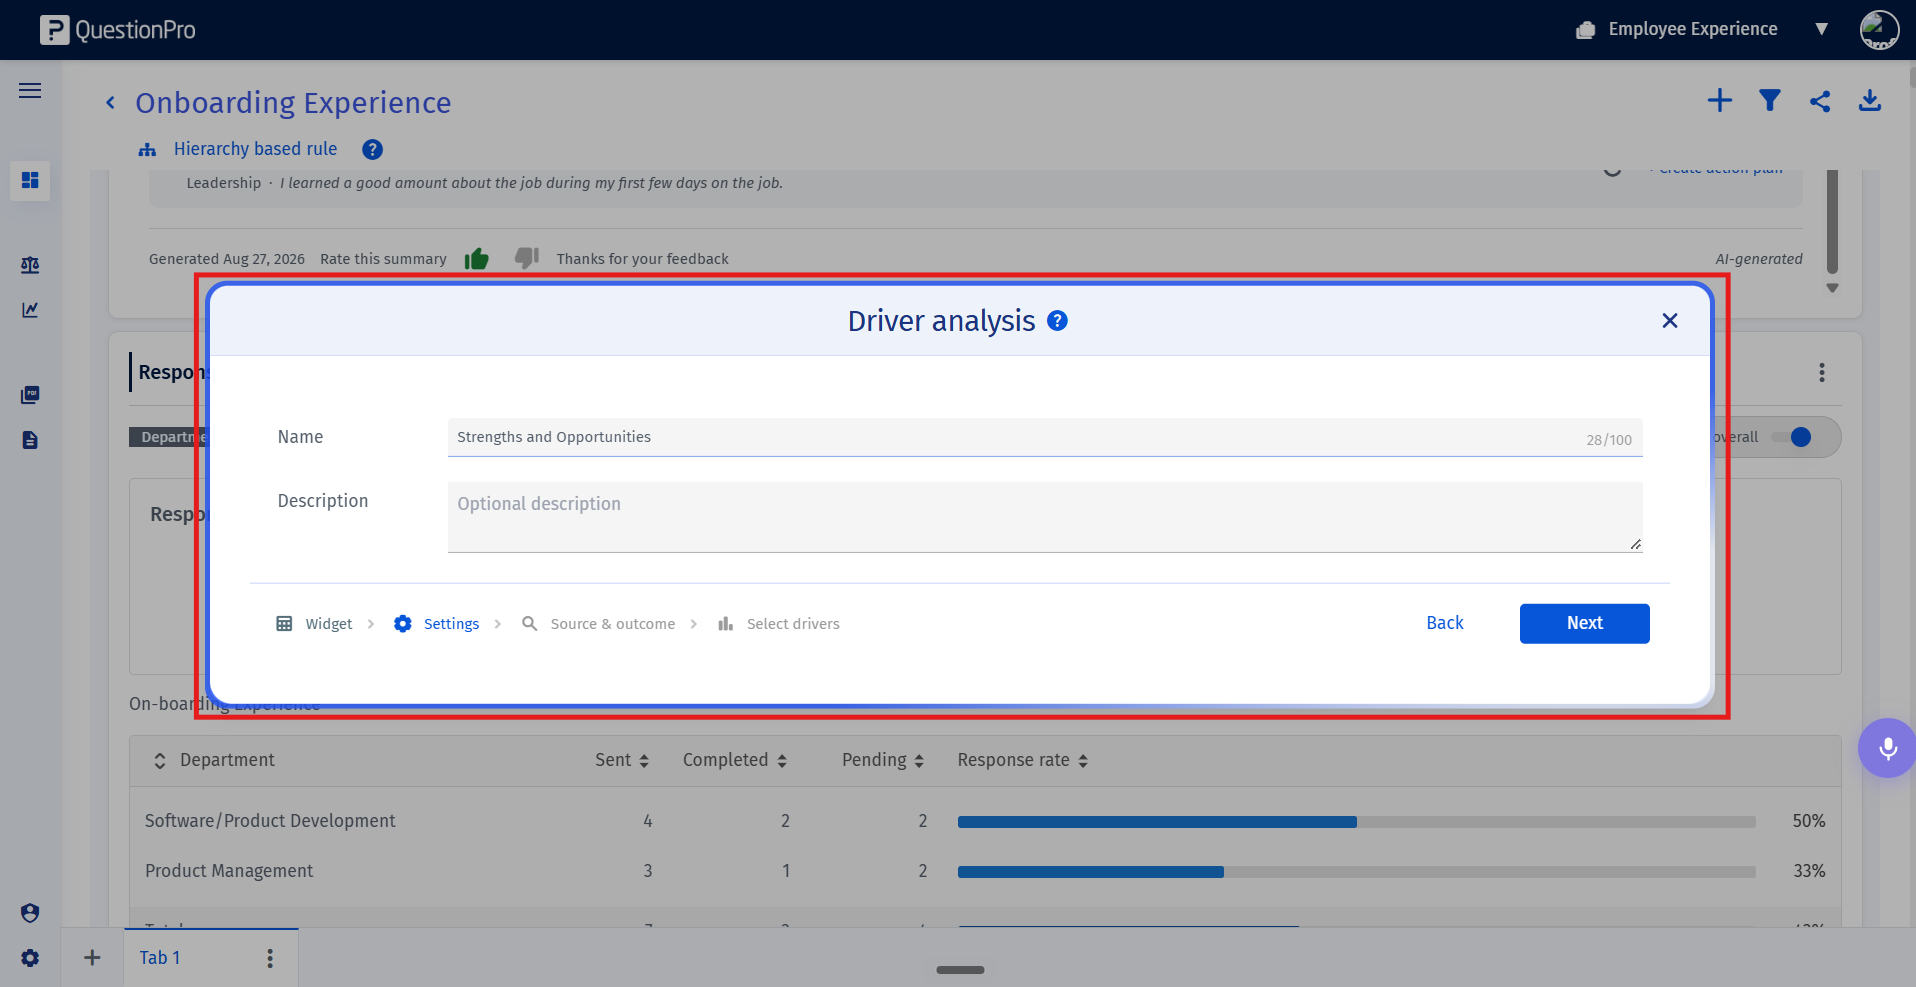
- In Step 1 of the configuration modal, enter the Widget Title and optional description.
- In Step 2 (Source and Outcome), select your survey, deployment and choose a single outcome variable (e.g., "Transparency" or "Overall Engagement") using the radio button.
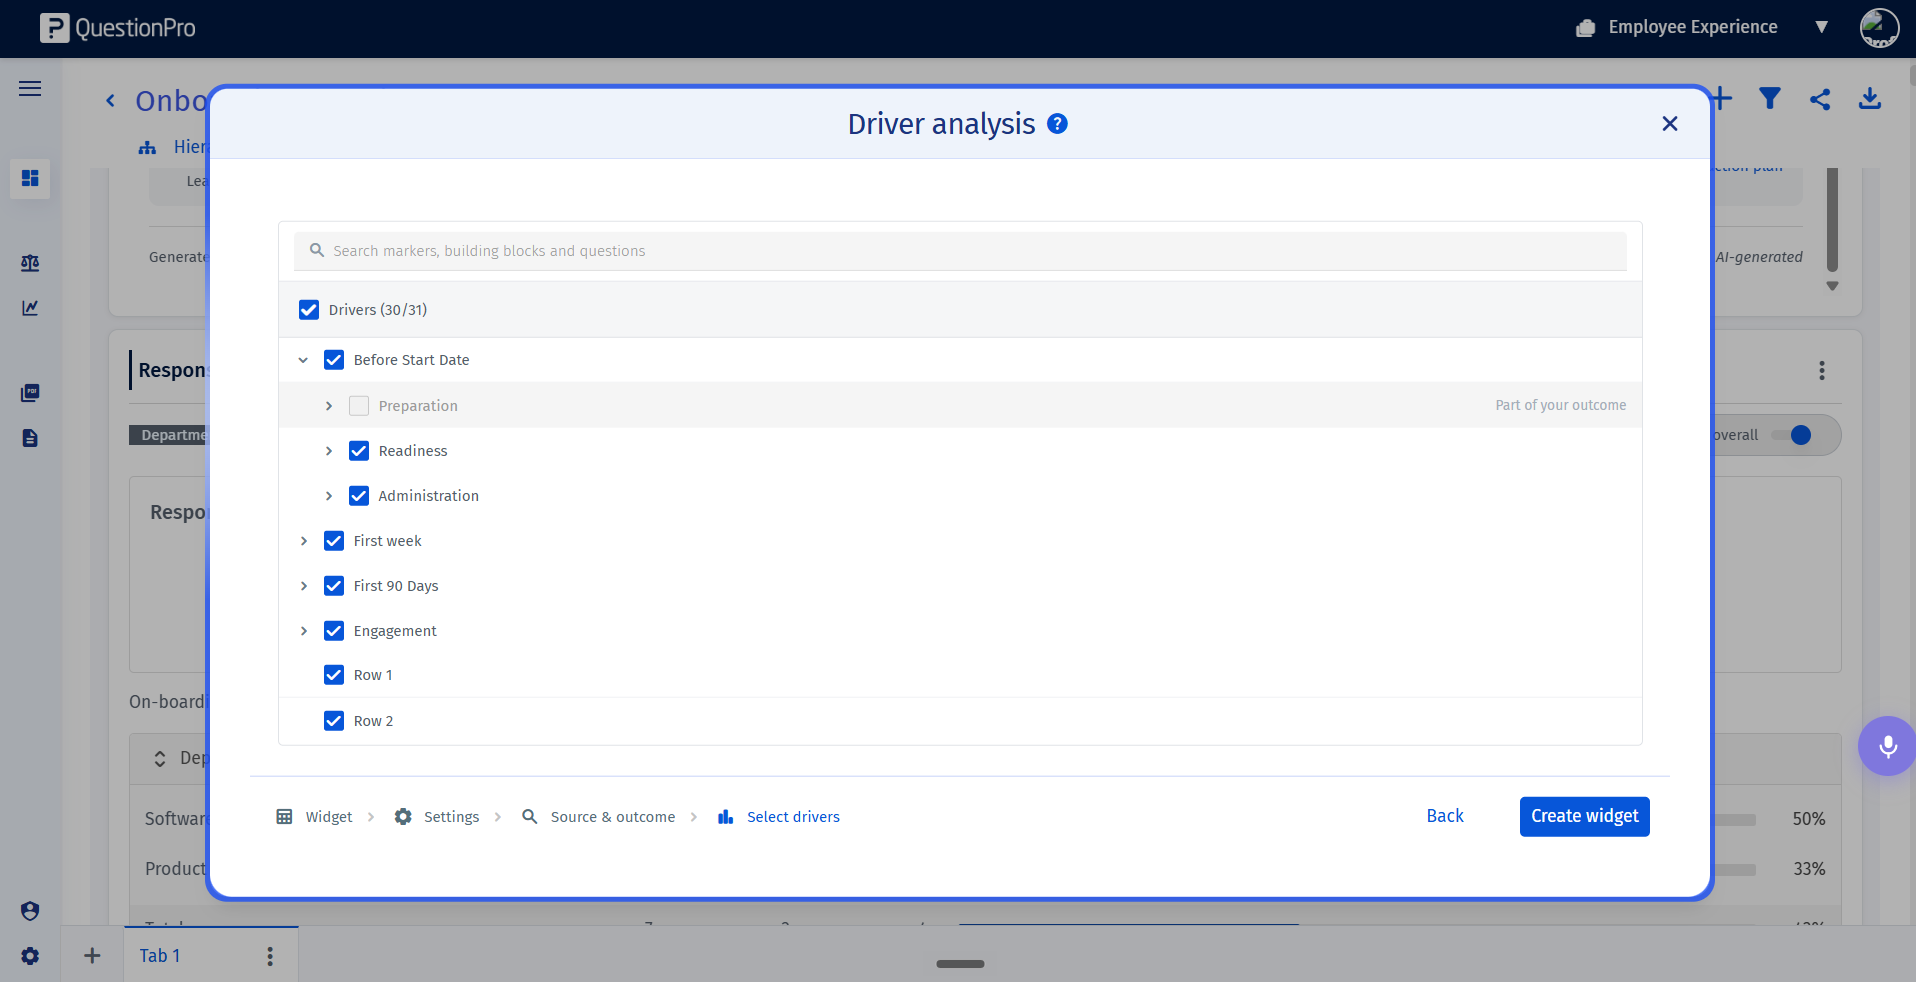
- In Step 3 (Select Drivers), select the driver metrics you wish to evaluate against your outcome variable using the checkboxes. Any metrics that overlap with your selected outcome variable will be disabled automatically with an explanatory message. Click Create Widget.
- Once created, the rendered widget displays the Quadrant Scatter Chart with a sub-header confirming the target outcome analyzed: "The selected drivers explain the impact on [Outcome Name]".
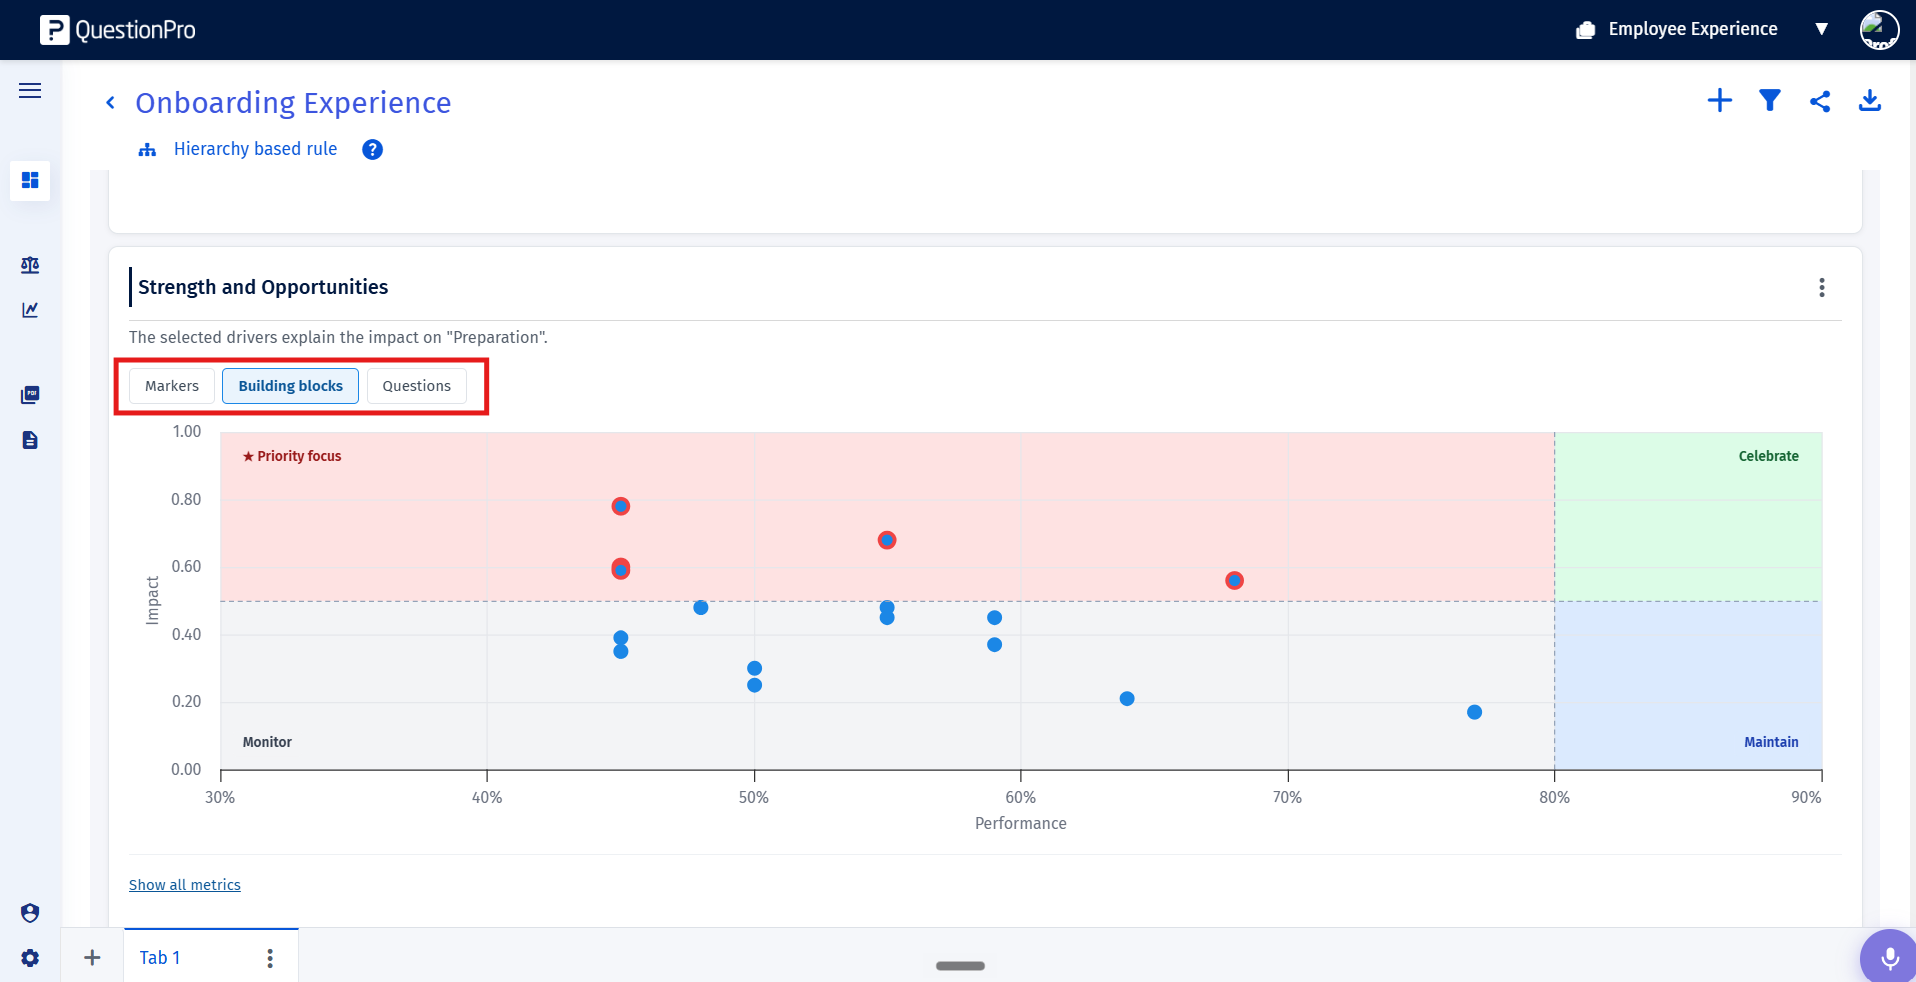
- Use the metric level toggle bar at the top of the widget to switch between Markers, Building Blocks, and Questions to analyze driver impact at different levels of granularity.
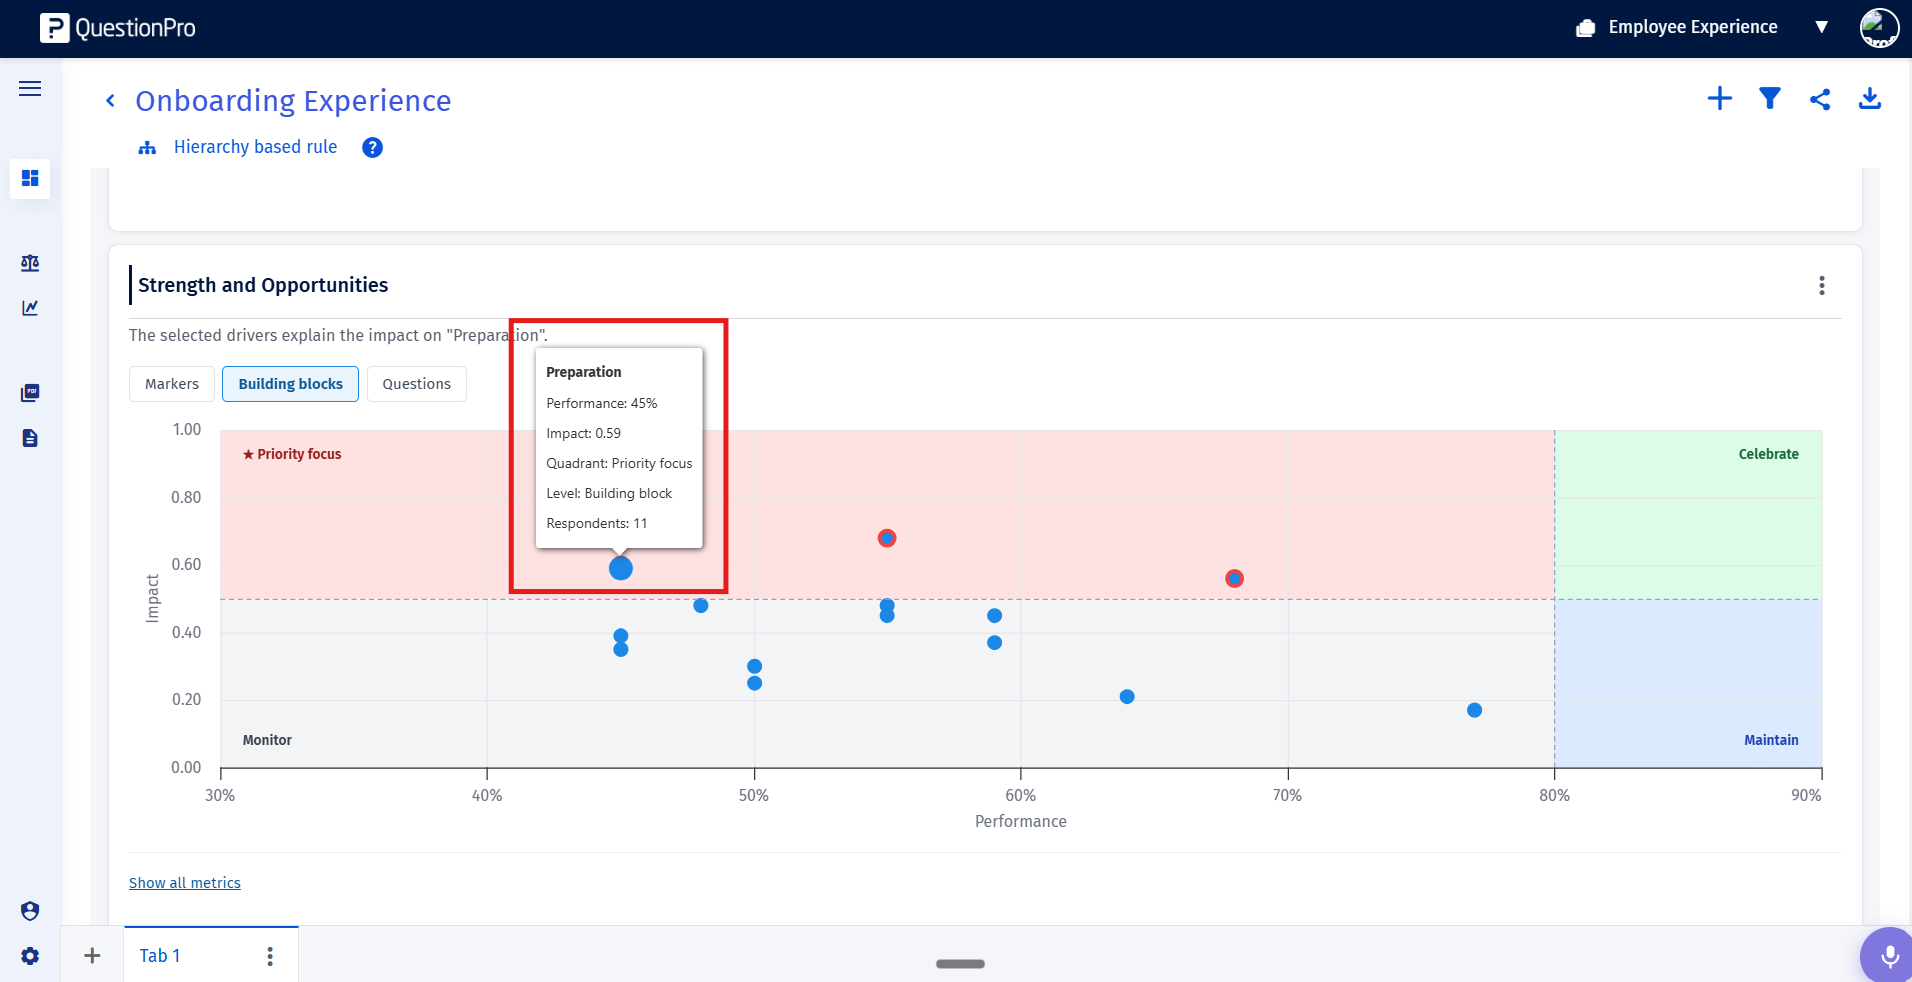
- Hover over any data point dot on the scatter chart to open a detailed tooltip displaying the metric name, exact Performance %, Impact score (|r| to 3 decimal places), quadrant classification, and metric level.
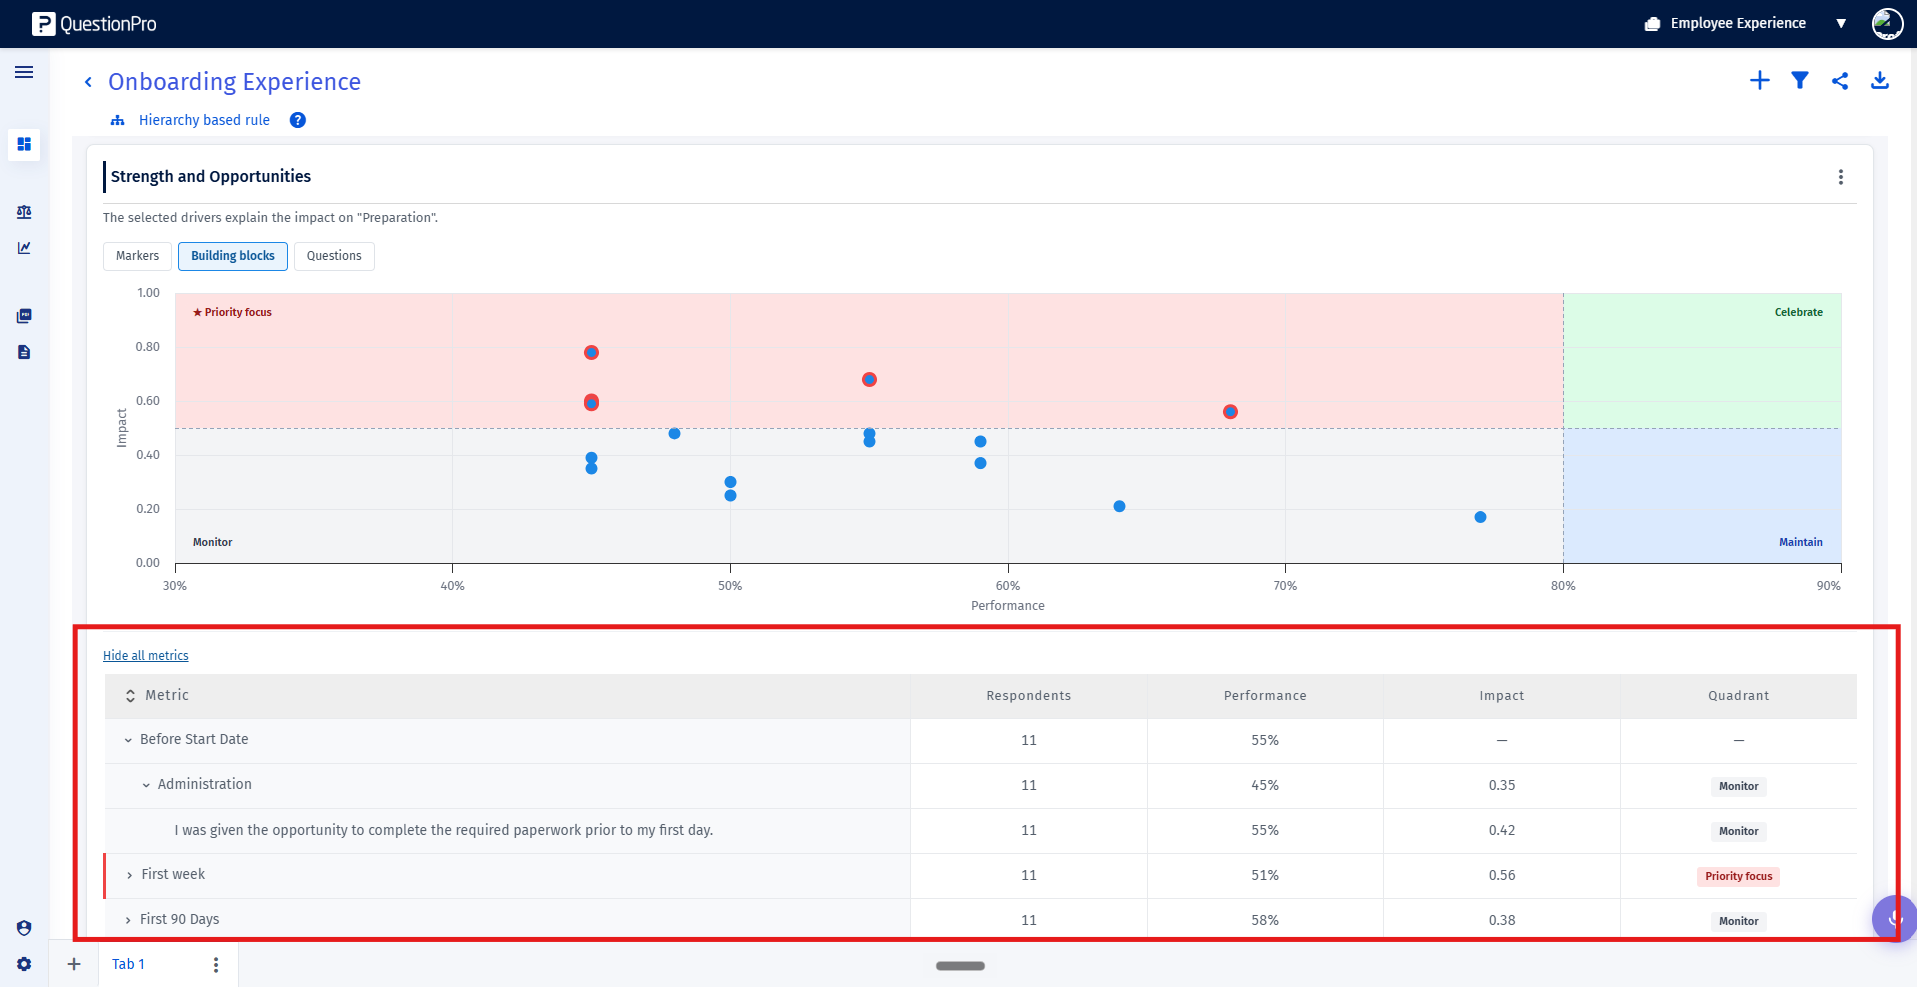
- To view a structured table breakdown below the scatter chart, click Show all metrics. The Priority Focus items are highlighted by a red left border.
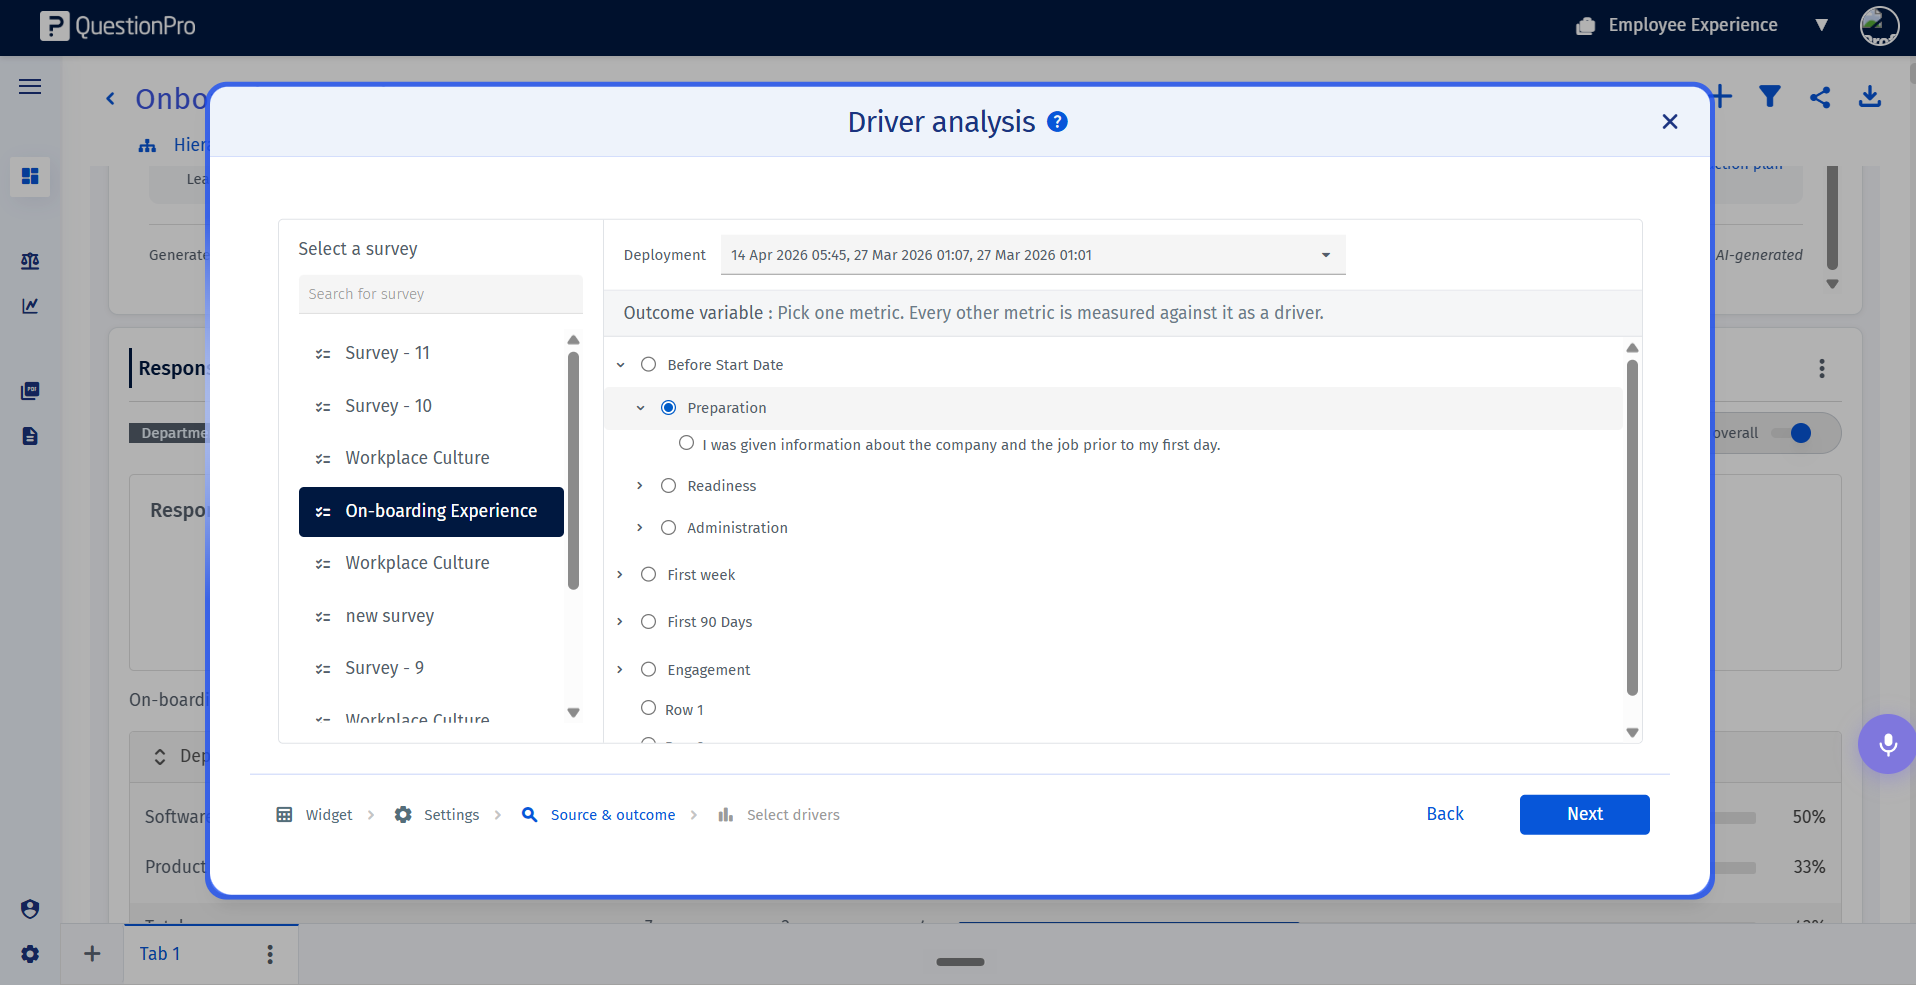
Important Note: Defining the outcome variable in Step 2 automatically filters available options in Step 3 to eliminate overlapping metrics and avoid part-whole data contamination.
You may also be interested in...
