

- Custom Variable Widget
- Priority Matrix
- Heatmap Widget
- Grid Widget
- Weighted mean widget
- Comment List widget
- Widget Filters
- Ranking List Widget
- Distribution Chart
- NPS Widget
- Trend Widget
- Word Cloud Widget
- Cross tab widget
- KPI Comparison Widget
- Bubble chart
- Custom Metric Trend Chart
- Trend Comparison Widget

Analytics
Analytics provides a centralized view of your Closedloop workspace performance. You can monitor ticket activity, identify operational issues, evaluate closed-loop outcomes, track SLA performance, analyze root causes, and review support staff performance.
The dashboard includes interactive metrics that allow you to navigate directly to the tickets behind the reported numbers. You can also customize the dashboard at the workspace level, configure the information displayed, and share the dashboard with external stakeholders through a public link.
Analytics organizes workspace performance data into the following sections:
- Reporting Period: Select a reporting period to analyze workspace performance over a specific duration. Trend charts automatically adjust their time granularity based on the selected period.
- Attention KPIs: Monitor current operational issues, including SLA breaches, unassigned tickets, and critical aging tickets.
- Closed-loop Outcomes: Evaluate winback completion, Loop First Contact Resolution (FCR), detractor recovery, and Winback NPS.
- SLA and Resolution Performance: Track SLA compliance, average resolution time, created versus resolved tickets, and resolution ratios by priority.
- Diagnosis and Root Cause Analytics: Analyze tickets by type, priority, and survey source. Review root causes, actions taken, and Root Cause Analysis.
- Segment Analysis: Compare ticket volume and average resolution time across selected segments.
- Support Staff Analytics: Review ticket ownership and available staff performance metrics.
- Dashboard Filters: Apply common filters to narrow down the data displayed across relevant dashboard widgets.
- Dashboard Sharing: Generate a public dashboard link and optionally protect it with a password.
- Dashboard Settings: Configure widget visibility, chart value display, and segment selection at the workspace level.
The reporting period determines the date range used by period-based Analytics widgets. By default, the dashboard displays data for the last 30 days.
You can select from the following reporting periods:
- Last 7 days
- Last 30 days
- Last 90 days
- This month
- Last month
- Custom date range
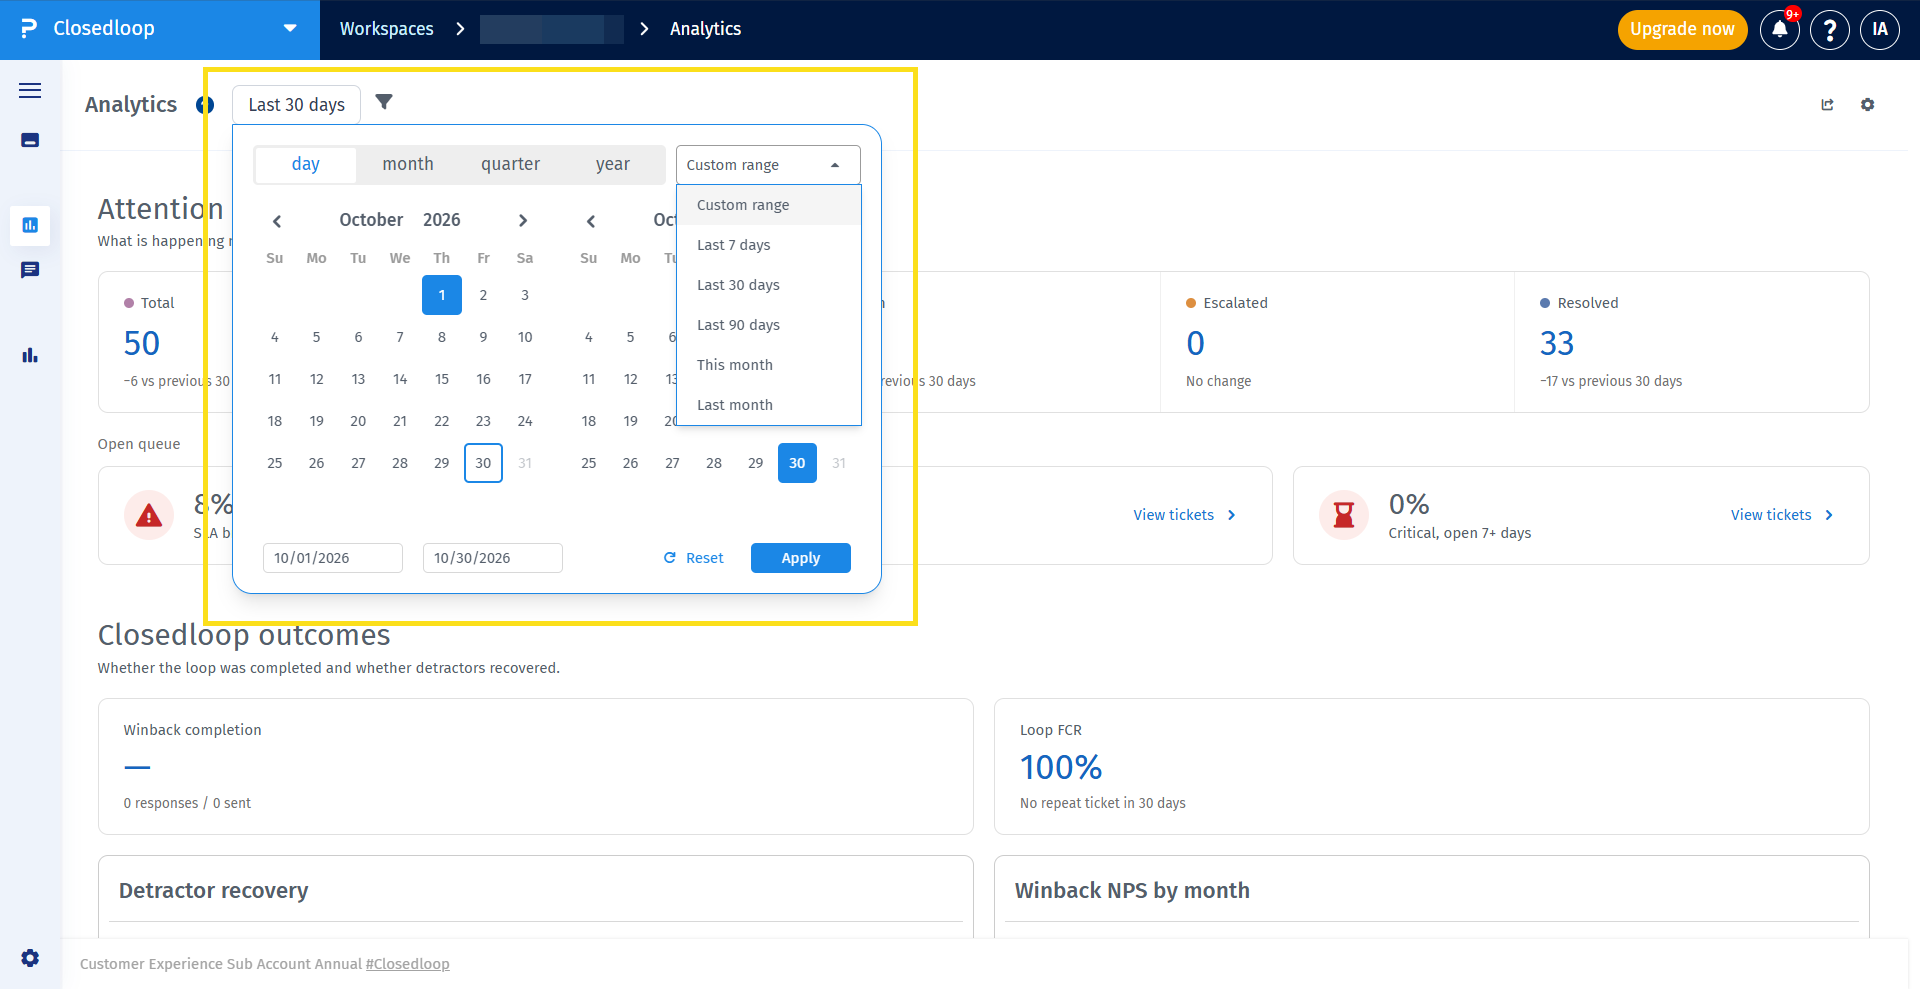
When you change the reporting period, all period-based widgets refresh using the selected dates.
Where applicable, period-based metrics also support comparison against the previous equivalent period.
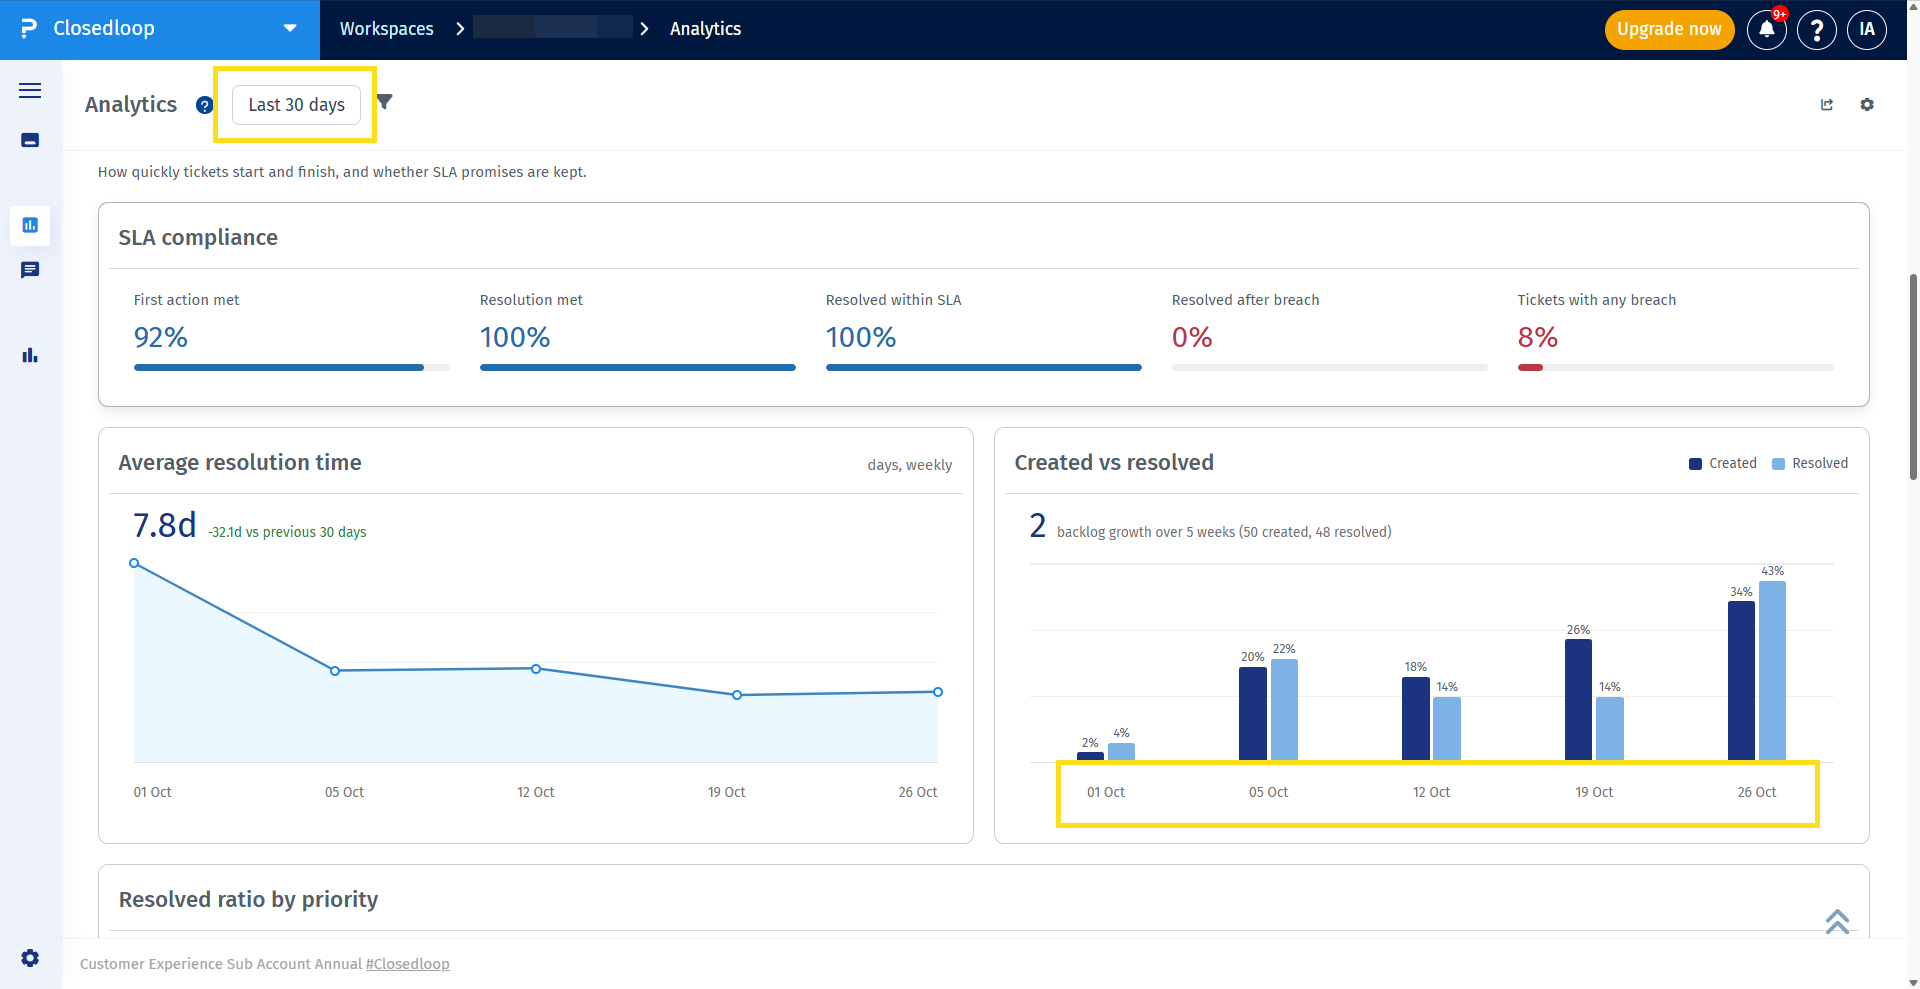
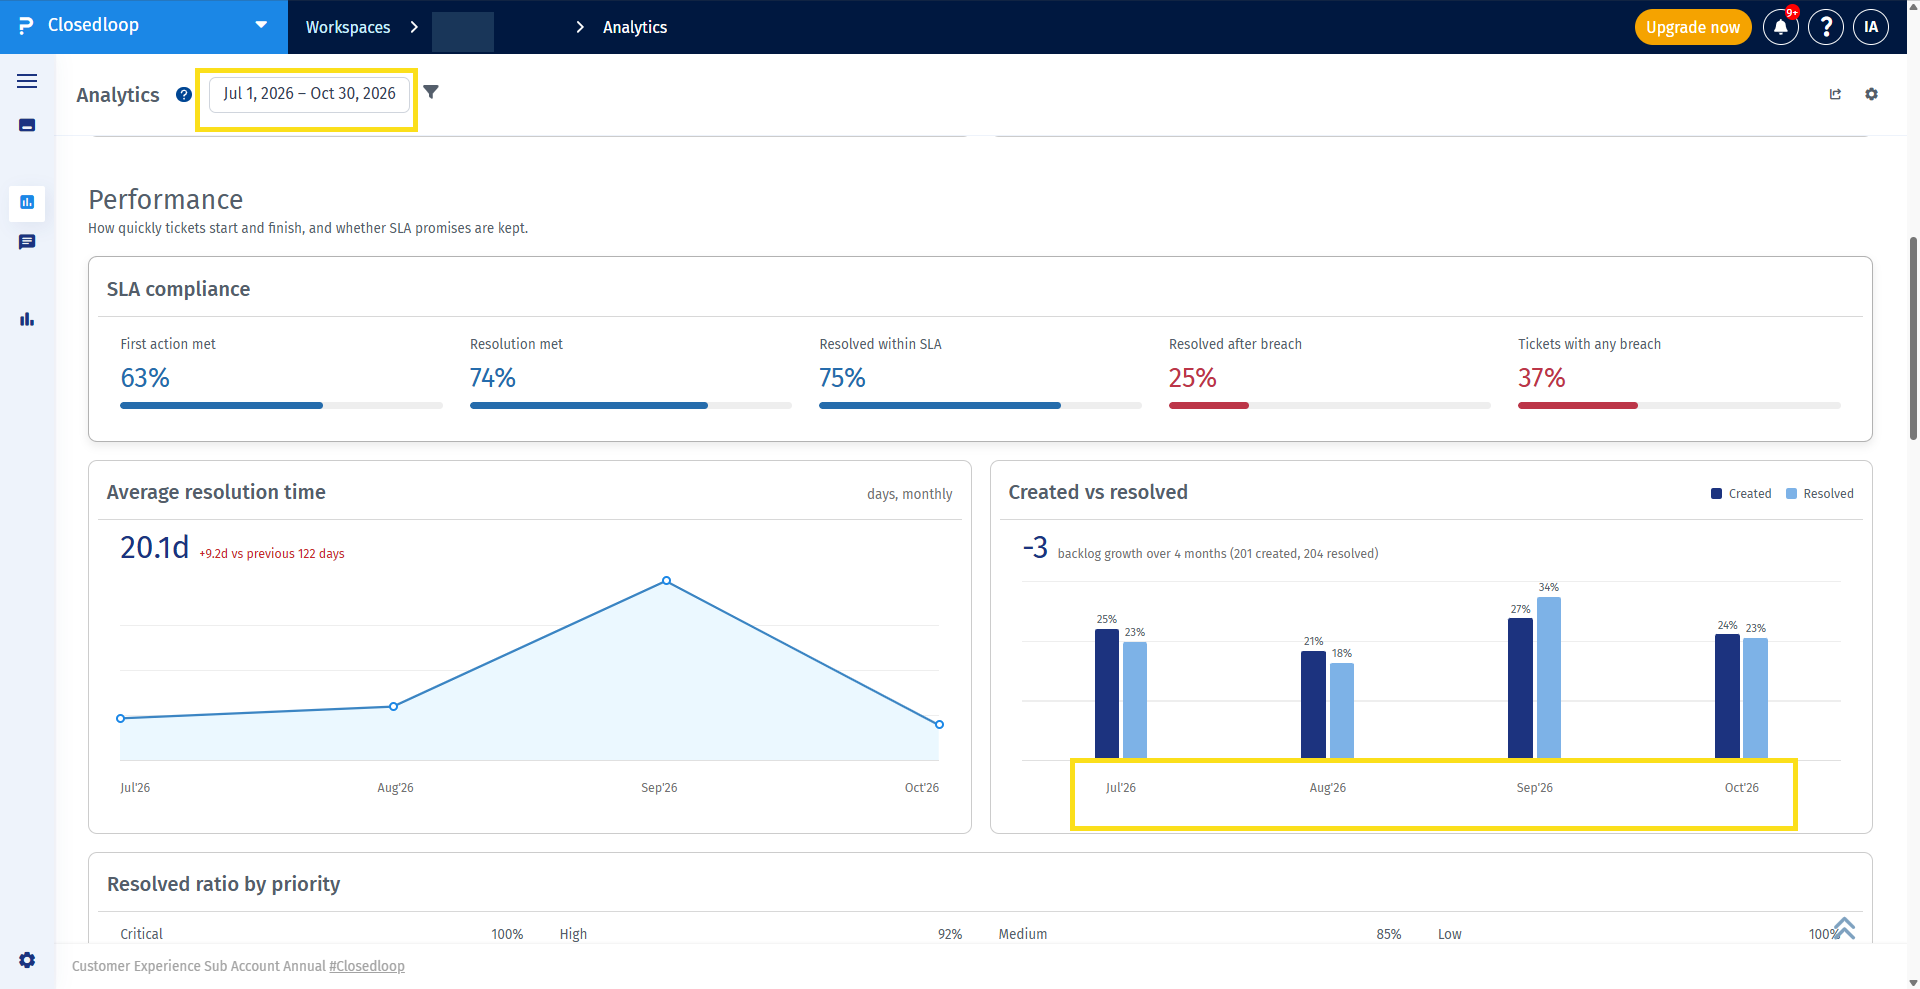
Analytics automatically adjusts the time granularity of trend charts according to the selected reporting period. This helps you view data at an appropriate level of detail without configuring the time interval separately for every chart.
Depending on the reporting period, trends can be displayed using daily, weekly, monthly, or quarterly aggregation.
Attention KPIs highlight current operational issues in your workspace that may require immediate action.
The Attention section includes the following metrics:
- SLA Breached: Displays tickets that have breached their applicable SLA.
- Unassigned: Displays tickets that do not have an assigned owner.
- Critical Aging: Displays critical tickets that have been open for an extended period and may require attention.
These metrics represent the current state of the open ticket queue rather than activity restricted to the selected reporting period.
You can click an Attention KPI to open the corresponding filtered ticket list and investigate the tickets requiring action.
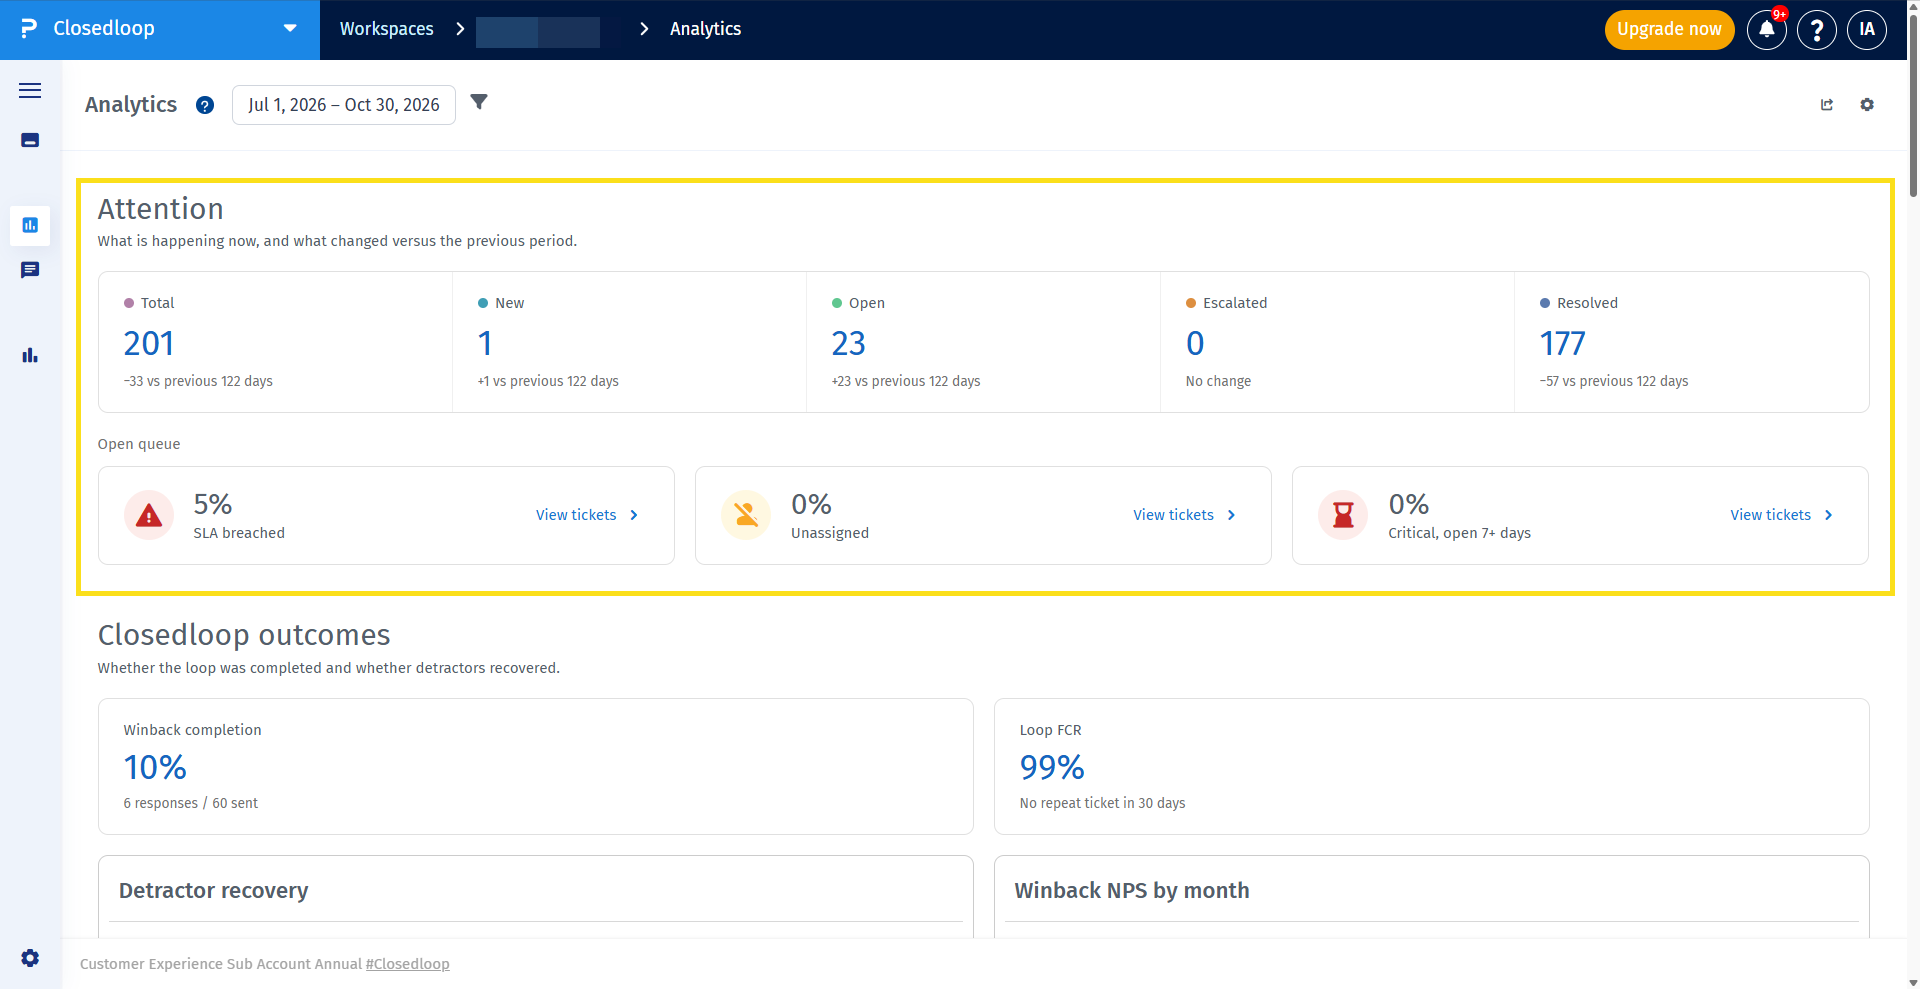
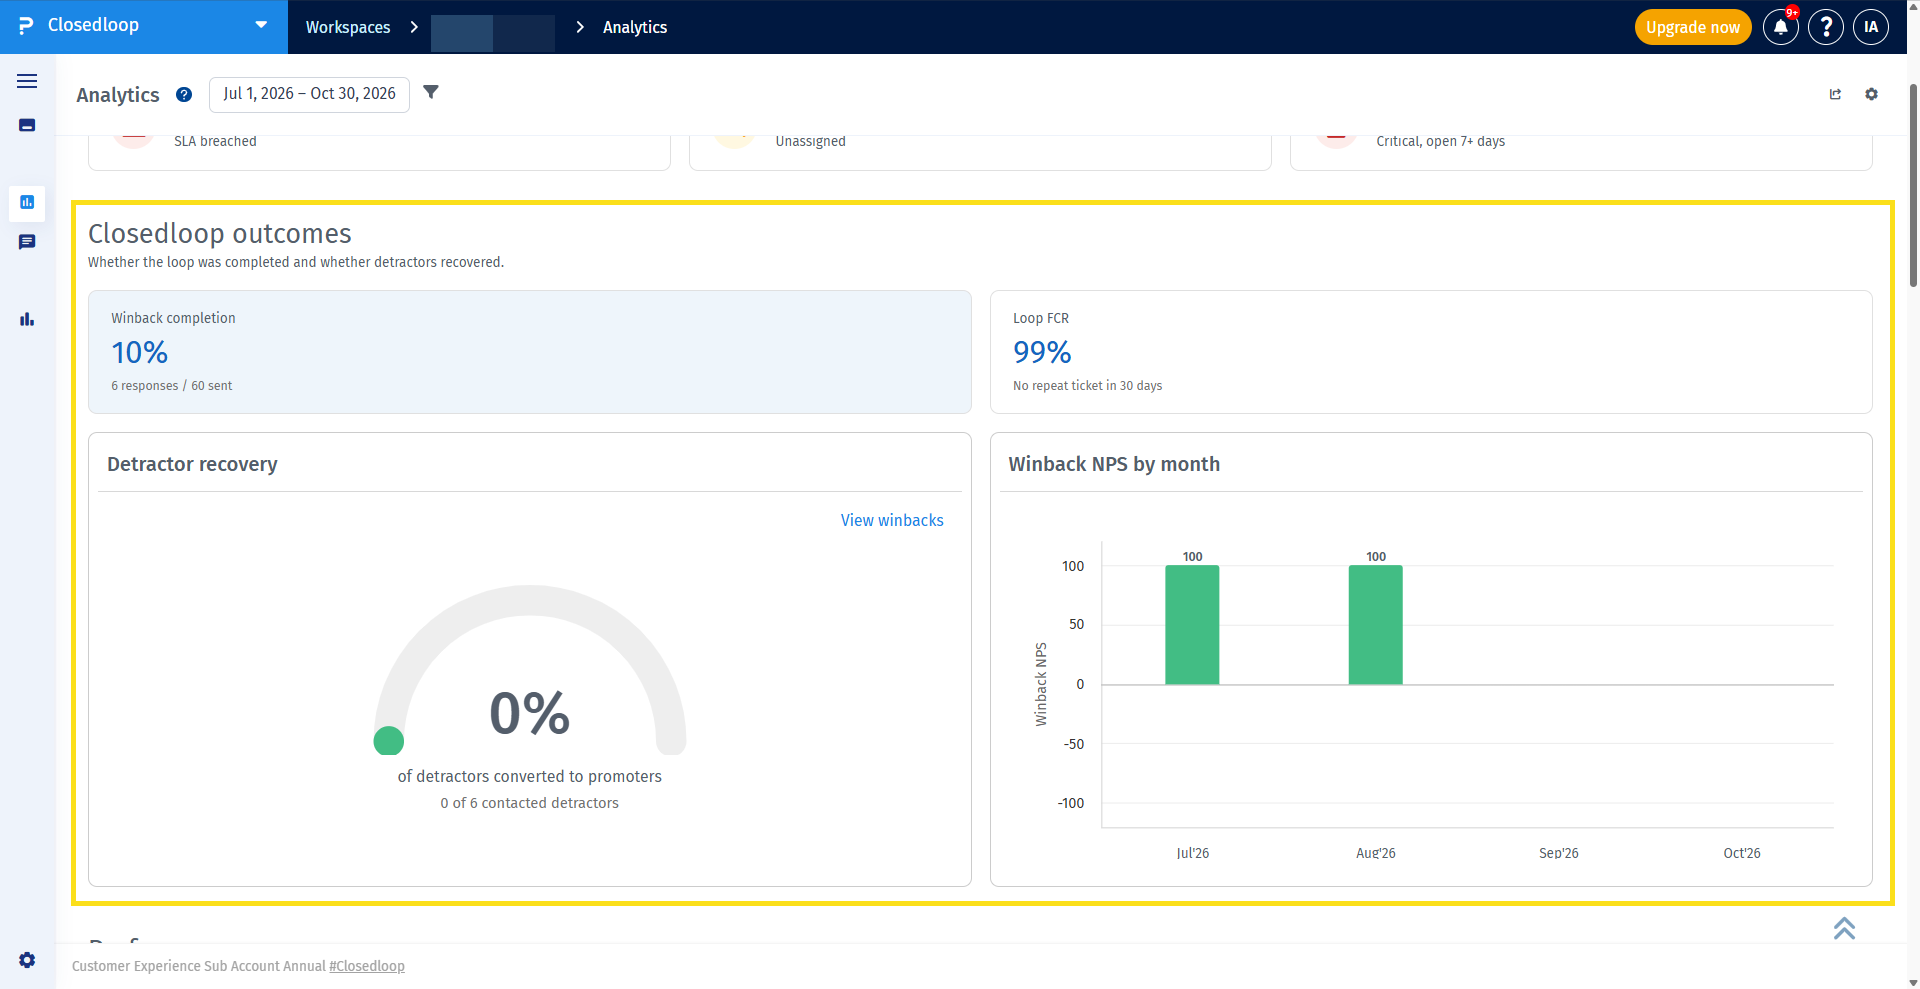
The Closed-loop Outcomes section helps you evaluate how effectively your team follows up on customer feedback and completes the feedback resolution process.
The section includes the following metrics:
- Winback Completion: Measures the completion of winback activities.
- Loop FCR: Provides visibility into First Contact Resolution performance within the closed-loop process.
- Detractor Recovery: Tracks the recovery of customers who provided detractor feedback.
- Winback NPS: Displays Winback NPS trends over the selected reporting period.
Applicable metrics support drilldown into the corresponding resolved tickets, allowing you to investigate the underlying records.
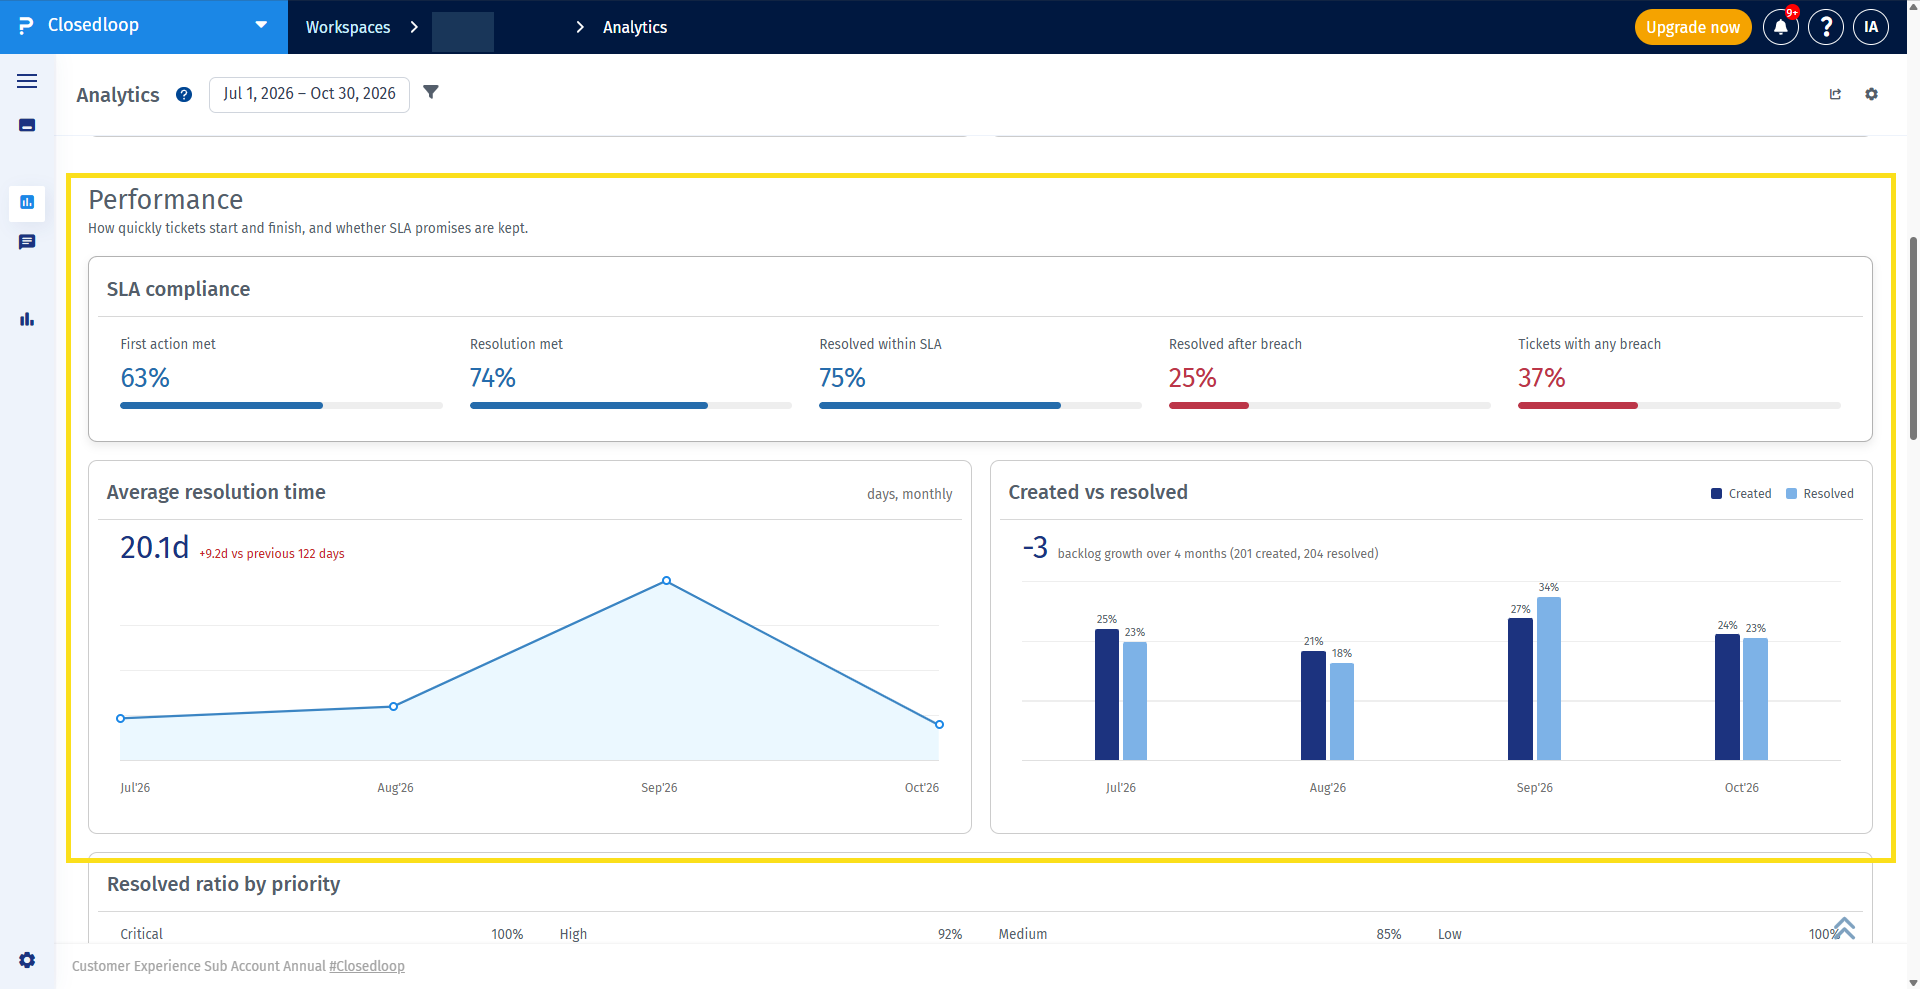
The SLA and Resolution Performance section helps you monitor how efficiently your team handles and resolves tickets.
The available analytics include:
- SLA Compliance: Displays SLA performance, including breach and resolved-within-SLA metrics.
- Average Resolution Time: Shows the average time taken to resolve tickets over the selected reporting period.
- Created vs Resolved: Compares the number of tickets created with the number of tickets resolved over time.
- Resolved Ratio by Priority: Displays ticket resolution ratios across different priority levels.
Where supported, you can click the metrics to view the underlying tickets and investigate SLA or resolution performance.
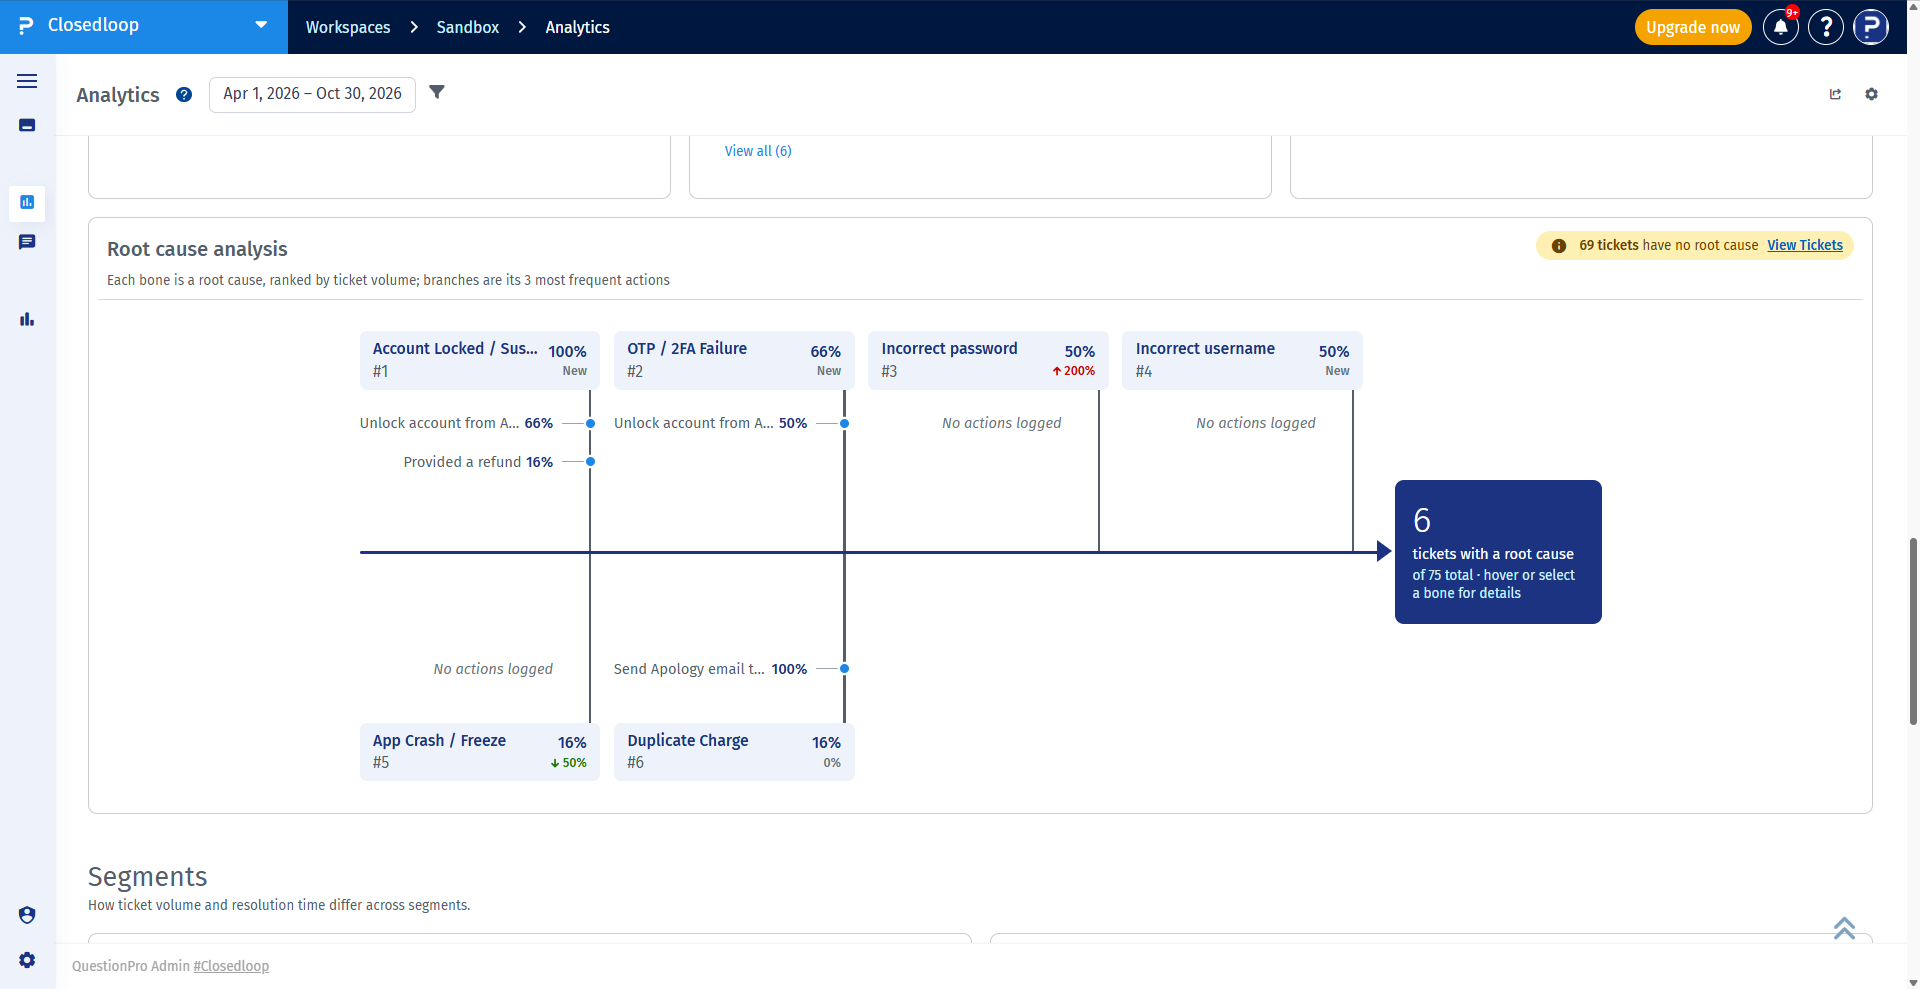
The Diagnosis section helps you understand the reasons behind customer issues and identify recurring problems affecting your workspace.
It includes the following analytics:
- Tickets by Type: Displays ticket distribution across different ticket types.
- Tickets by Priority: Displays ticket distribution across priority levels.
- Tickets by Survey Source: Shows the distribution of tickets based on their originating surveys.
- Root Causes: Displays the frequency of identified root causes.
- Actions Taken: Shows the frequency of actions recorded to address identified root causes.
- Root Cause Analysis: Provides a fishbone-style visualization to help analyze the underlying causes of recurring issues.
Applicable metrics support drilldown into the corresponding tickets, allowing you to investigate the issues and actions contributing to the reported data.
Segment Analysis allows you to compare ticket volume and resolution performance across different segments configured for your workspace.
The section includes:
- Tickets by Segment: Displays ticket volume across the selected segments.
- Average Resolution Time by Segment: Compares the average time taken to resolve tickets across different segments.
You can configure between 1 and 8 segments through Analytics Settings. Segment analytics also supports parent-segment rollups where applicable.
If you have not explicitly configured your segment selection, Analytics can display an automatically selected set of top segments within the configured limit.
Applicable segment metrics support drilldown into the corresponding ticket list.
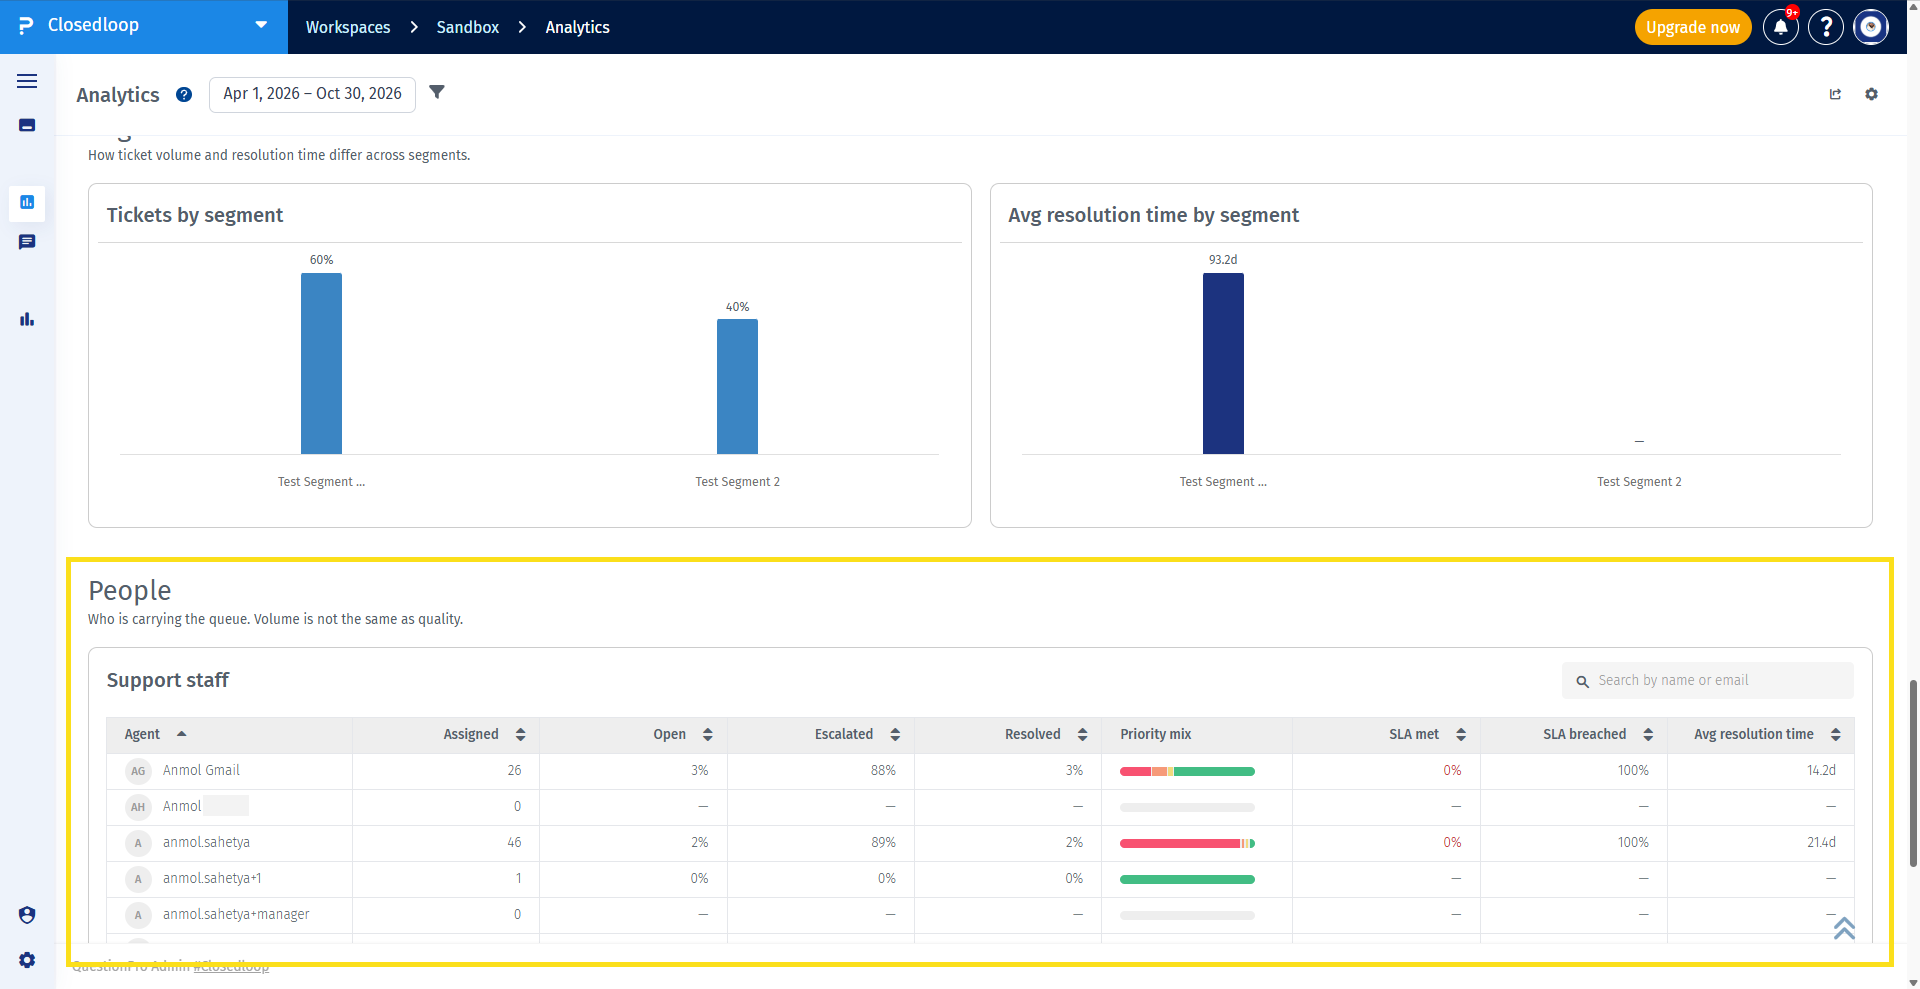
Support Staff Analytics provides visibility into ticket ownership and staff performance within your workspace.
You can use this section to review the distribution of ticket workload and related performance metrics available for individual support staff members.
This helps you understand how work is distributed across the team and identify areas that may require additional attention.
Analytics provides shared filters that allow you to narrow down the data displayed across relevant dashboard widgets.
- Open the Analytics dashboard.
- Locate the Filters control in the dashboard header.
- Select the required filter criteria.
- Apply the filters to refresh the relevant dashboard widgets.
To remove the applied filters, use the available clear filters control.
Applying or clearing filters refreshes the widgets that use the shared Analytics data.
No. Analytics filters and the global reporting period work independently.
The reporting period determines the date range for period-based metrics, while Analytics filters narrow down the relevant ticket data.
The Analytics Filters control does not include separate Status, Priority, or Date filters. These are not part of the shared Analytics filter configuration.
Attention KPIs also respect the selected Analytics filters, but they continue to represent the current open queue and are not restricted by the selected reporting-period dates.
Yes. Analytics supports interactive drilldowns for applicable metrics.
When you click a drillable metric, you are redirected to the existing ticket list with the relevant filters applied.
The drilldown combines the filters currently applied in Analytics with the filters specific to the selected metric.
For period-based metrics, the selected reporting period is also carried into the ticket list.
For Attention KPIs, the ticket list is not restricted by the selected reporting period because these metrics represent the current open queue.
Yes. Analytics provides workspace-level settings that allow you to configure how dashboard information is displayed.
You can customize the following:
- Value Display: Choose between Percent and Count display modes for charts where both options are supported.
- Widget Visibility: Show or hide configurable widgets based on the information relevant to your workspace.
- Segment Selection: Select between 1 and 8 segments for Segment Analysis, where segment options are available.
These settings apply to the workspace rather than an individual user. As a result, the configured dashboard experience is shared across workspace users.
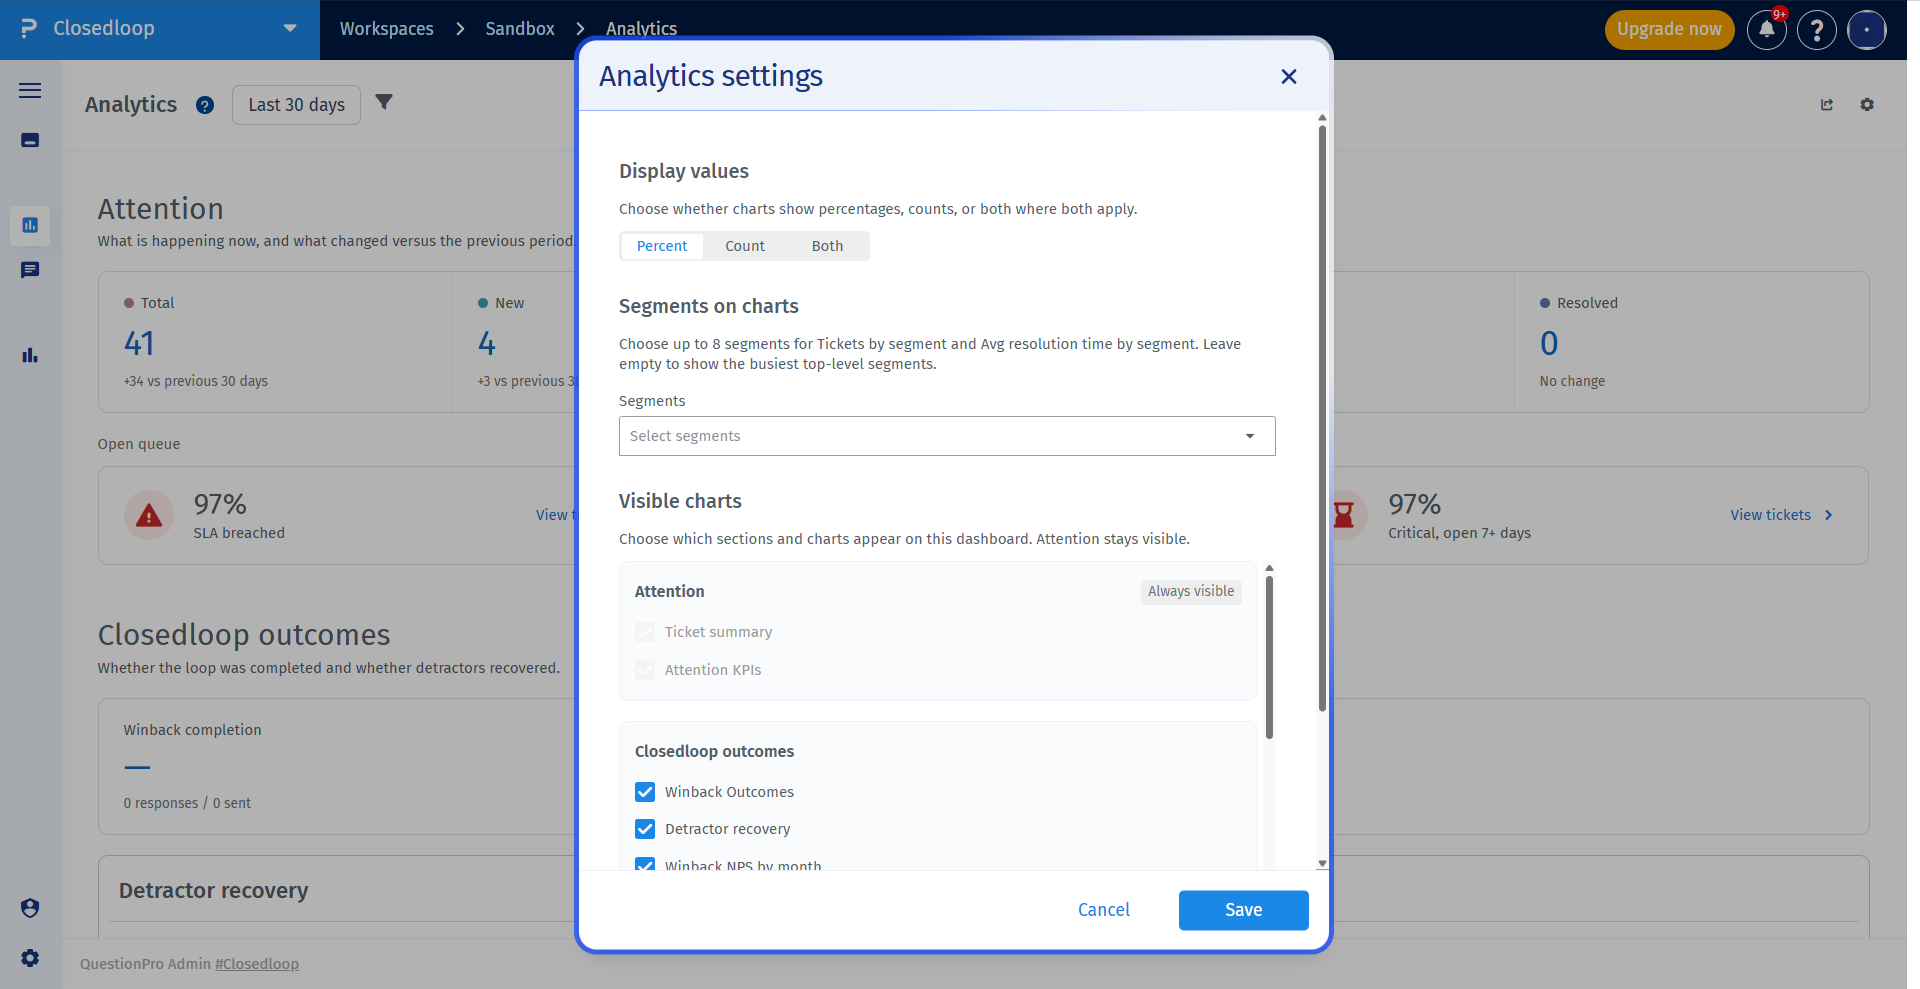
No. Attention widgets are mandatory and cannot be hidden through Analytics Settings.
Other configurable widgets can be shown or hidden depending on your workspace requirements.
When all configurable widgets within a section are hidden, that section is removed from the dashboard instead of displaying an empty section.
Analytics allows you to share your dashboard with stakeholders who do not have access to your Closedloop workspace.
Follow these steps to generate a public dashboard link:
- Open the Analytics dashboard.
- Click the Share control in the dashboard header.
- Open the Share Dashboard experience.
- Enable dashboard sharing.
- Copy the generated public dashboard URL.
- Share the URL with the intended external stakeholders.
Recipients can access the shared Analytics dashboard through the public link without requiring product access.
You can disable dashboard sharing through the same Share Dashboard experience when you no longer want the public link to provide access.
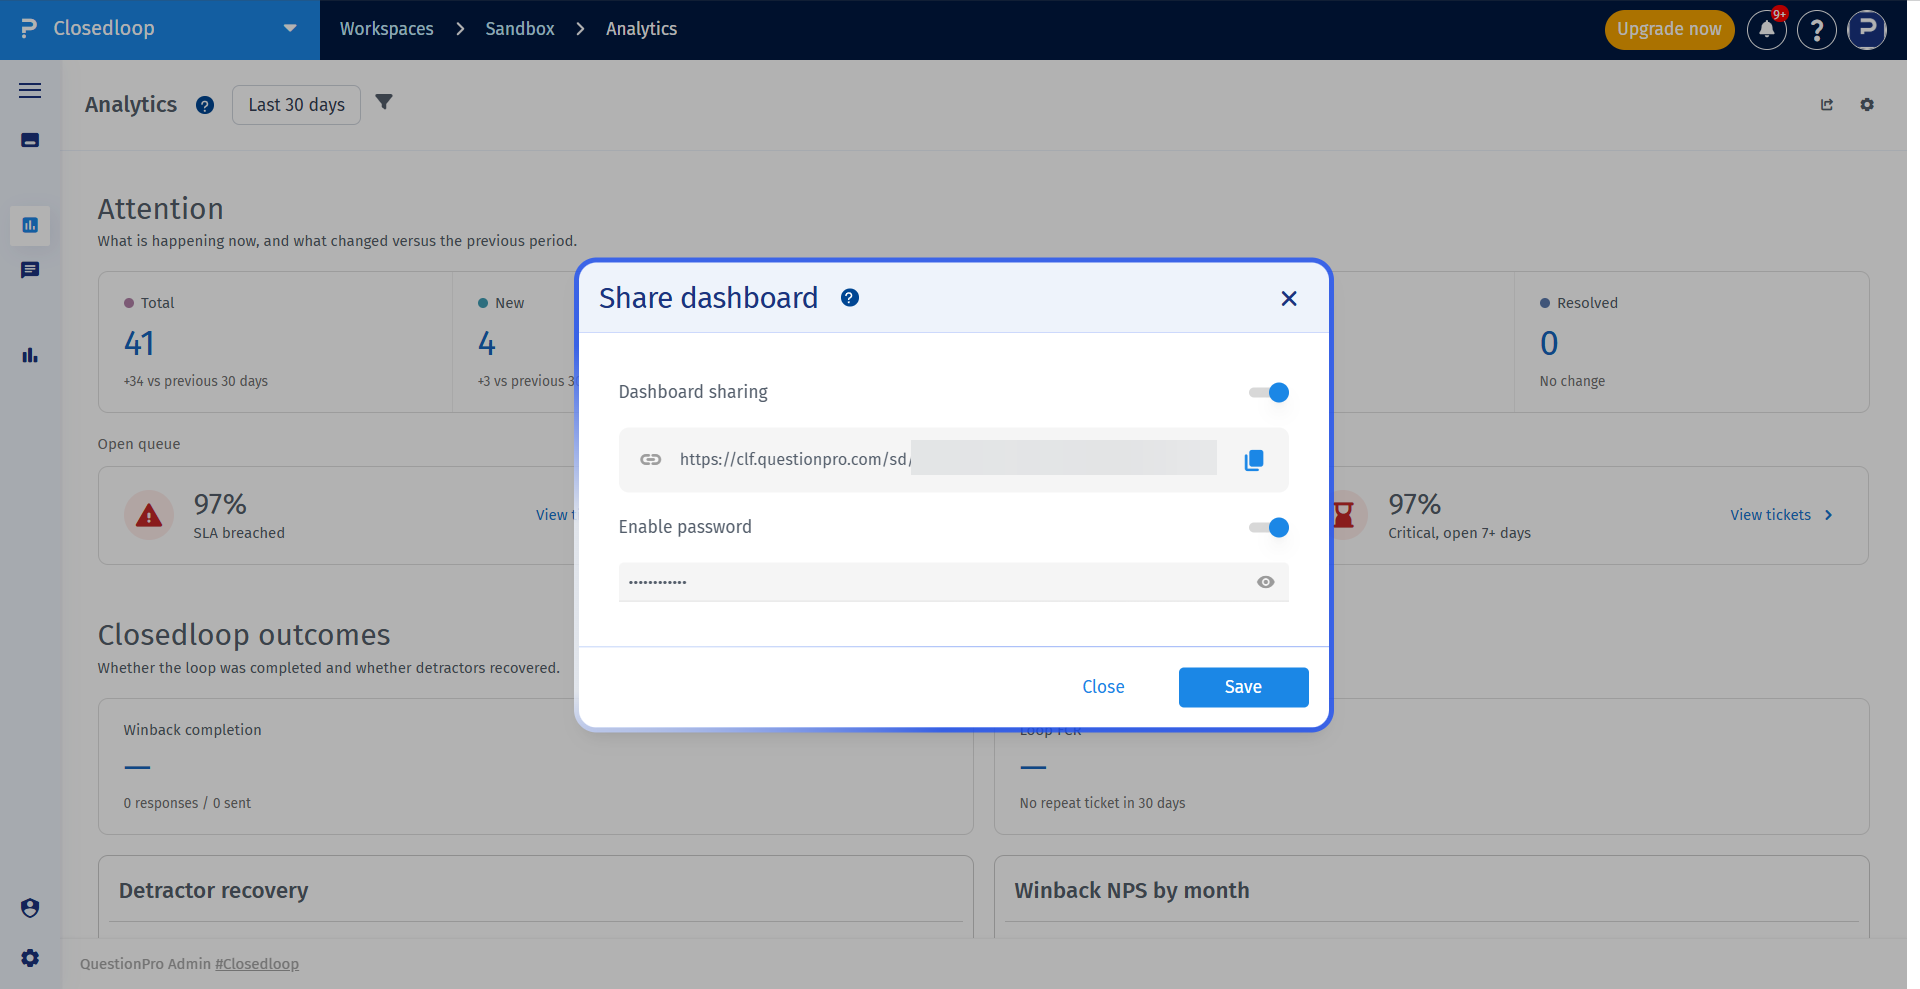
Yes. Analytics supports optional password protection for public dashboard links.
To enable password protection:
- Open the Share Dashboard experience.
- Enable dashboard sharing if it is not already enabled.
- Enable the password protection option.
- Enter a password that meets the required security criteria.
- Save or apply the sharing configuration.
The password must meet all of the following requirements:
- At least 8 characters.
- At least one uppercase letter.
- At least one number.
- At least one special character.
Password protection is optional. You can enable or disable it through the available Share Dashboard controls.
Public Analytics dashboard links do not have an automatic expiry period.
You can disable dashboard sharing through the available Share controls when you want to stop providing access through the public link.
The current sharing experience does not include a separate link-expiry or password-revocation workflow.
No. Analytics Settings are maintained at the workspace level rather than the individual-user level.
Changes to widget visibility, value display, and segment selection apply to the workspace and are shared across its users.
Saved configurations persist on the server and remain available after users log out and log in again.
- Get a centralized view of Closedloop workspace performance.
- Identify current operational issues through Attention KPIs.
- Monitor closed-loop outcomes and customer recovery performance.
- Track SLA compliance and ticket resolution trends.
- Identify recurring customer issues through root cause and action analysis.
- Compare ticket volume and resolution performance across segments.
- Understand ticket ownership and support staff workload.
- Investigate metrics directly through ticket-level drilldowns.
- Customize the dashboard to display information relevant to your workspace.
- Share workspace performance with external stakeholders through public dashboard links.
